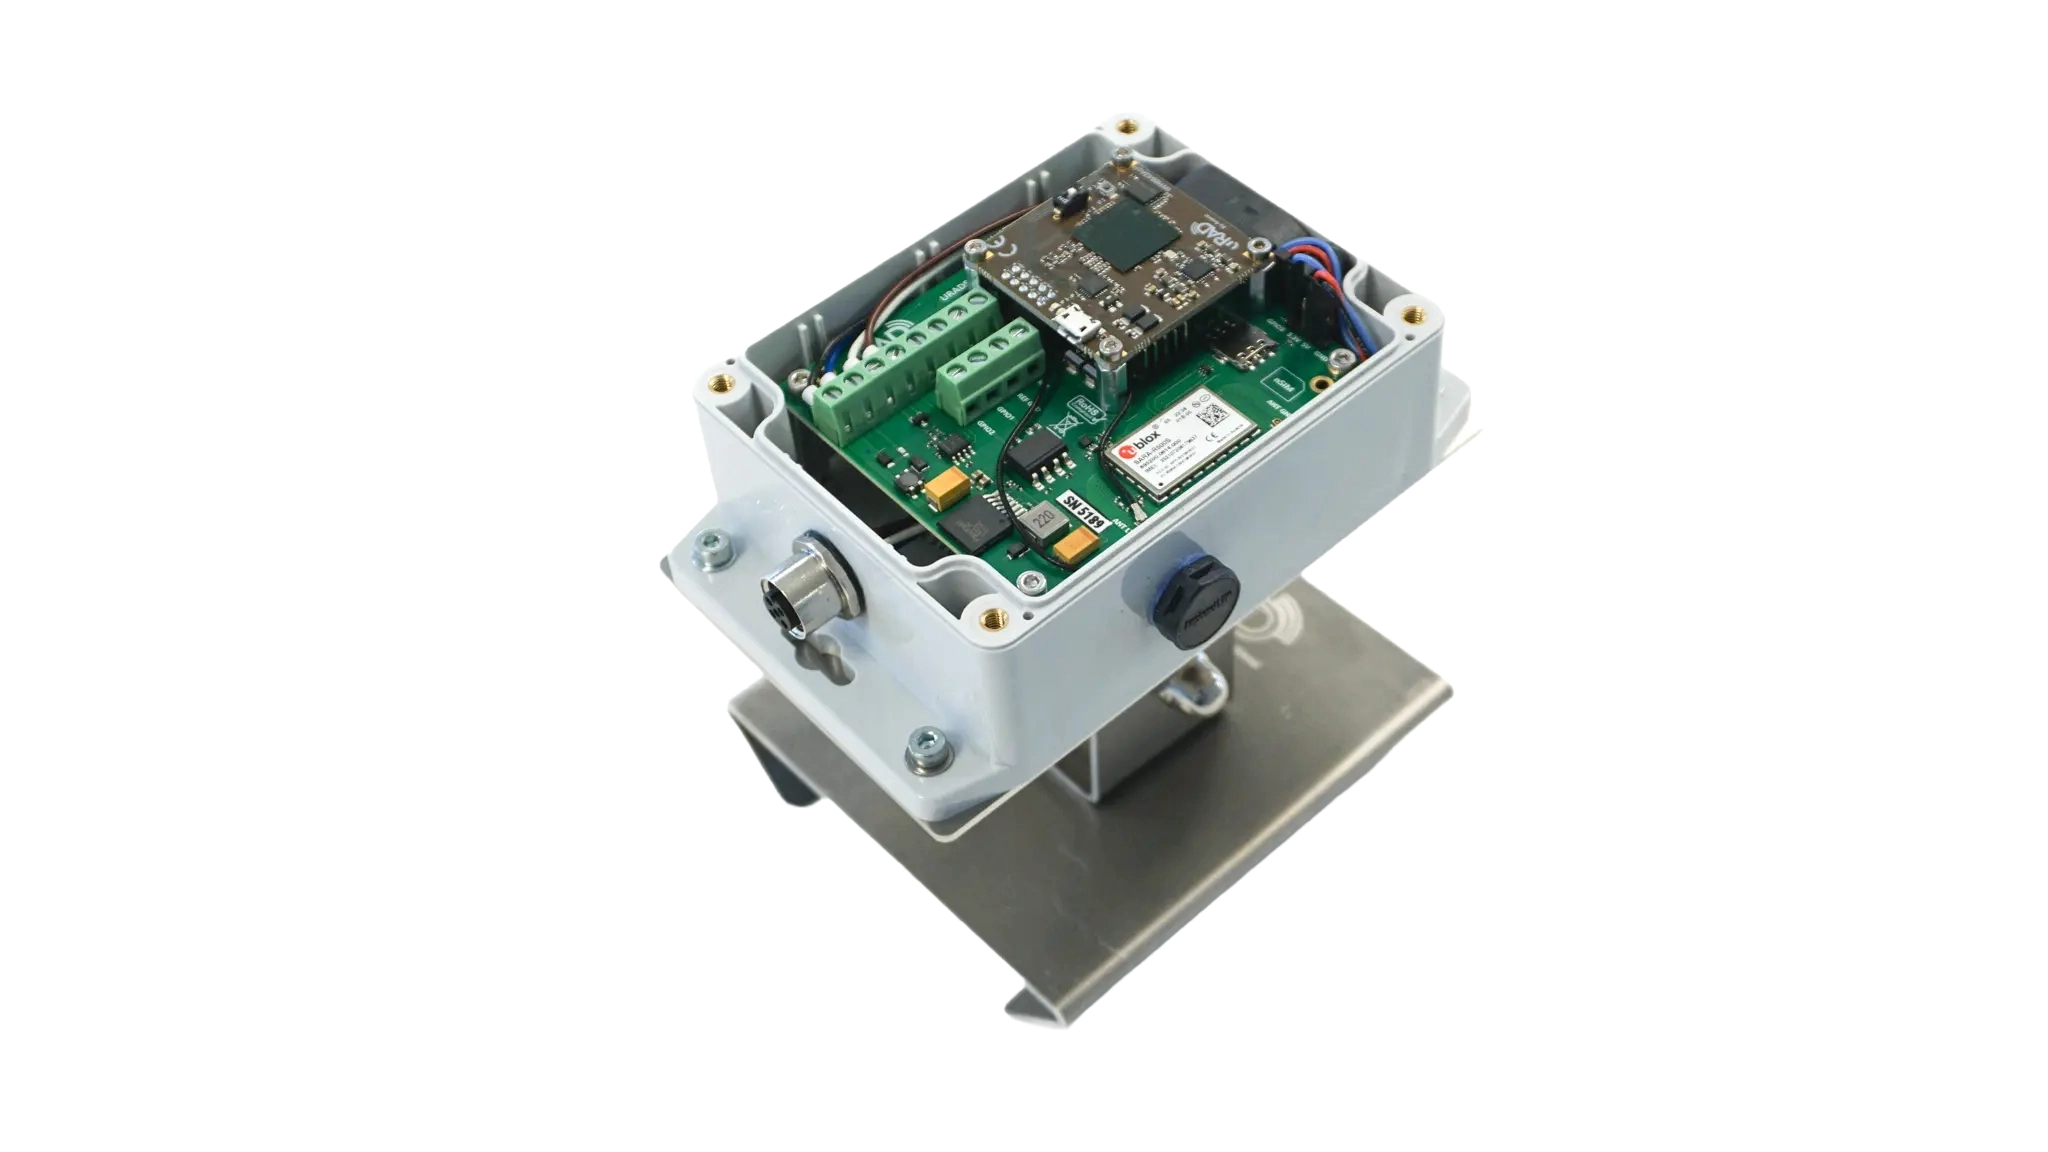
Bicycle counting in Pamplona with uRAD radar
The network went live in May 2022 with seven radar counting points and grew to eight when Labrit joined. This page brings together the deployment and the results published by Pamplona City Council.
- Passages recorded
- 2.734.426
- Counting network
- 7 → 8 points
- Published resultss
- May 2023
Figures for the twelve-month period published by the City Council. Labrit has contributed data since January 2023, so not every point covers the full period.

 Watch the case video
- Client
- Pamplona City Council
- Network
- 7 → 8 points
- Period
- 2022–23
- Technology
- Radar + 3G/4G
Measuring the real use of the cycle network
Objective data, not estimates.
The aim is to understand how the municipal cycle network is used, with the city's own data, comparable across points. The network measures continuously how many bicycles pass, in which direction and at what speed, with units mounted on lamp posts and no cameras in the lane.
A network in daily use
Pamplona's cycle network is part of everyday mobility in the city.
Continuous recording by time and direction of travel
Continuous counting with the data timestamped in half-hour bands, the direction of travel and the speed, at several points of the network and under the same criteria.
No cameras and no works in the lane
The units are installed on existing lamp posts, measure continuously and capture no images of the lane.
From seven counting points to a permanent network of eight
How the network grew: from the first seven counting points to the balance for eight locations.
-
2019
Start
Pamplona Smart Labs
The City Council identifies Anteral as a participant in the 2019 edition of Pamplona Smart Labs, where similar devices were tested for traffic studies.
See deployment
2019Pamplona Smart Labs -
May 2022
Deployment
Launch with seven points
The cycle network gains seven recording points. The radar counters, supplied by Anteral, are installed on lamp posts and transmit the data over 3G/4G.
See architecture
2022Seven counting points -
2023
Consolidation
First balance for the eight-point network
Labrit joined the network on 23 December 2022. The balance published in May 2023 includes data from this point since January, so it does not cover the full twelve months.
See results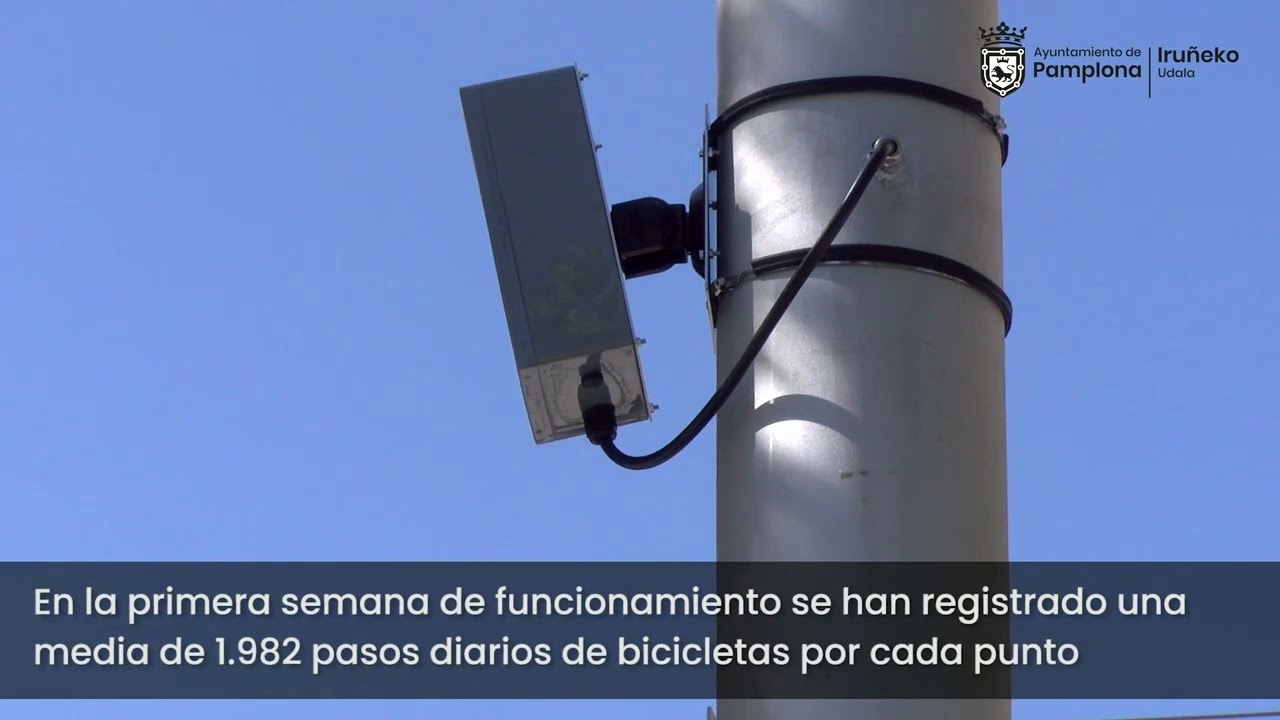
2023Eight points in operation
Timeline sources: Pamplona City Council, news item of 13 January 2023 on the addition of Labrit and results release of May 2023 ↗..
Own, comparable and continuous data to analyse the cycle network.
See published results
How the counting network was deployed
Eight points on infrastructure that already exists: the units are installed on lamp posts of the cycle network itself, with no intervention on the pavement, no buried loops and no cameras in the lane.
From the radar to the analytics platform
The path of the data, from a bicycle passing to the report. The chain follows the elements described by the City Council for this deployment.
 Bicycle
Generates the traffic on the cycle network.
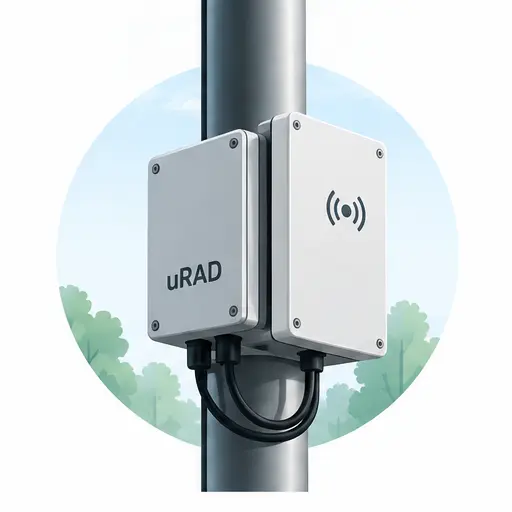 Radar uRAD
Detects the passage, the direction and the speed.
 3G/4G
3G/4G
Connectivity to send the data.
 Processing
The system receives and processes the information.
 Web platform
Access to data, reports and statistics.
 Reports
Results to support planning.
The City Council documents the radar, the 3G/4G connectivity, the external processing and the management platform. Not every component of the IT infrastructure is publicly detailed.
Results of twelve months of measurement
Figures published by Pamplona City Council in May 2023 for the twelve months analysed.
How to read these figures. A passage is one crossing recorded by a counter, not a person or a unique trip. These are historical data for the published period, not current annual figures. Labrit has contributed data since January 2023, so it does not cover the full twelve months. uRAD does not recalculate or estimate: the values are those of the City Council release ↗.
of the recorded cyclist traffic heads towards the city centre.
is the busiest hour of the day across the network.
- September
- March
- October
are the three months that accumulated the most passages in the period.
On Pío XII, one in five passages travels in the opposite direction
Figure published by the City Council for the one-way lane on Pío XII in the period analysed. It describes traffic behaviour on that stretch; it is not an indicator of radar performance.
See official source →Summary of published results
Source: Pamplona City Council| Figure | Published value |
|---|---|
| Cyclist passages recorded | 2.734.426 |
| Daily average | 7,492 passages |
| Counting points | 8 |
| Average speed | 18,8 km/h |
| Highest average speed by point | 25,9 km/h (Labrit) |
| Passages heading to the city centre | 62,9 % |
| Busiest hour | 14:00–15:00 h |
| Busiest months | September, March and October |
| Riding against the flow | 20.5 % in the one-way lane on Pío XII |
Source of the results: Pamplona City Council, 16/05/2023 ↗. Deployment details: 2022 municipal report ↗.
What a permanent counting network makes it possible to analyse
Three general capabilities, whichever municipality deploys it.

Trends over time
Continuous series that show how the use of the network develops.

Split by direction
Volume in each direction, including riding against the flow in one-way lanes.

Support for planning
A quantitative basis for sizing interventions and assessing their effect.
Want to see everything cycle counting can do? Bicycle counting with radar →
Applicability: general capabilities of a counting network, not decisions taken by the City Council.
Evaluate a similar counting network
We review the points you want to measure, the geometry of each location and the kind of data your department needs before proposing a configuration.
-
1
You define the pointsLocations, directions and the type of user to count.
-
2
We review the mountingAvailable support, geometry, power and connectivity.
-
3
You get the proposalEquipment, number of units and data format.
Technical validation based on geometry, mounting, power, connectivity and data needs. Explore the uRAD Smart Traffic range for counting projects..
Evaluate my counting network
Pamplona caseFields marked with * are required.
Your data is safe