
7days
A full typical week
Covers weekdays and the weekend, the minimum unit on which you can speak of a weekly pattern representative of the section.
- Weekdays and weekend
- Weekly profile
- Volumes and speeds
Measure for 7, 15 or 30 days —or set the period to suit the study— with no civil works. uRAD Smart Traffic records counts, speed, direction and classification per passage, with data exportable to CSV. You buy the equipment to run your own campaigns and reuse it at the sites that follow.
A reply from the technical sales team within 48 working hours.
Equipment available to purchaseTraffic engineering firms, mobility consultancies, local authorities and universities.
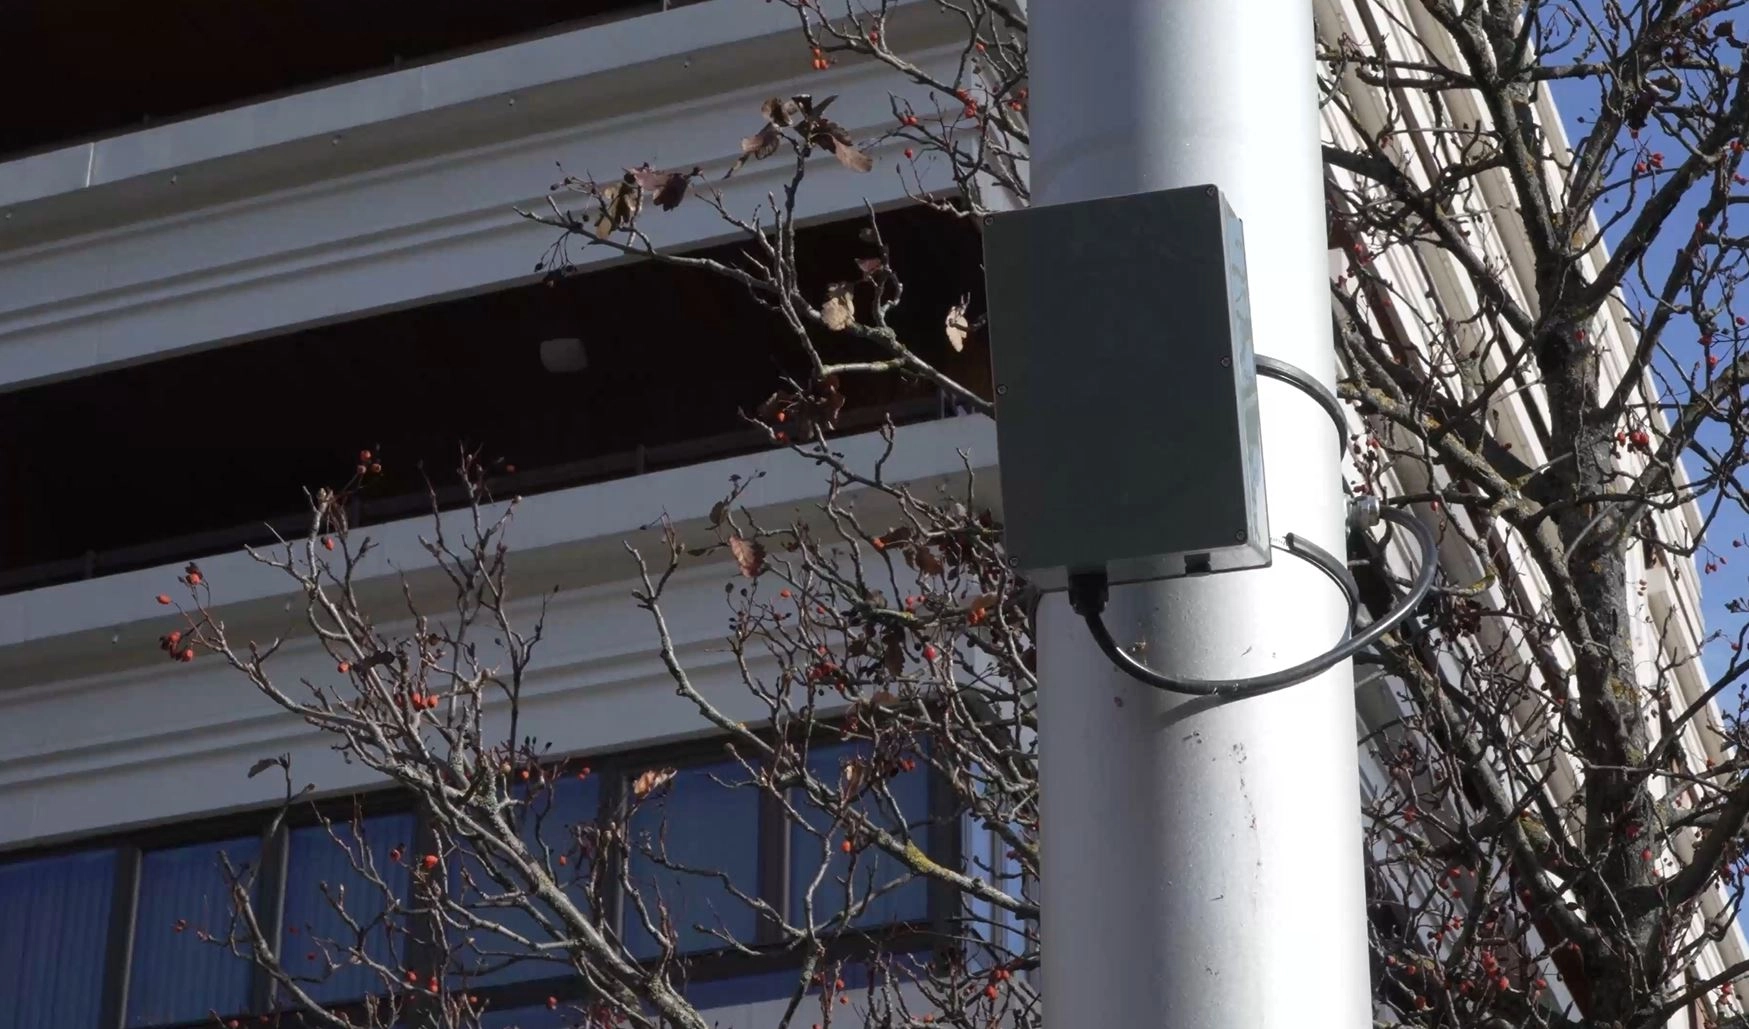
A traffic count bounded in time, planned to answer one specific question in a study.
The unit is installed at the survey site, records for a defined period —typically between a week and a month— and is then removed. Unlike a permanent count station, the aim is not to monitor the network continuously but to produce evidence for a specific piece of work: a mobility plan, a construction project, a residents' complaint or the appraisal of a scheme.
With radar the campaign needs no civil works: there is no cutting of the pavement and no inductive loops or pneumatic tubes laid across the carriageway. That cuts permits, deployment time and disruption to traffic during installation.
These three periods are the most common, but the duration is set to suit the question behind the study. Each one supports a different kind of conclusion and shapes how the unit is powered on site.
Covers weekdays and the weekend, the minimum unit on which you can speak of a weekly pattern representative of the section.
Lets you contrast two weeks against each other and spot whether one was affected by a one-off event, roadworks or weather. It carries more weight when the data will underpin a decision.
Reduces the weight of one-off anomalies and characterises how traffic evolves within the month, the usual basis when a study needs a stable reading of the section.
On annual indicatorsA temporary campaign characterises the period measured. Estimating annual indicators such as AADT requires defining the expansion method and applying, where appropriate, correction factors or reference count stations. Periods can also be extended or chained across several sections.
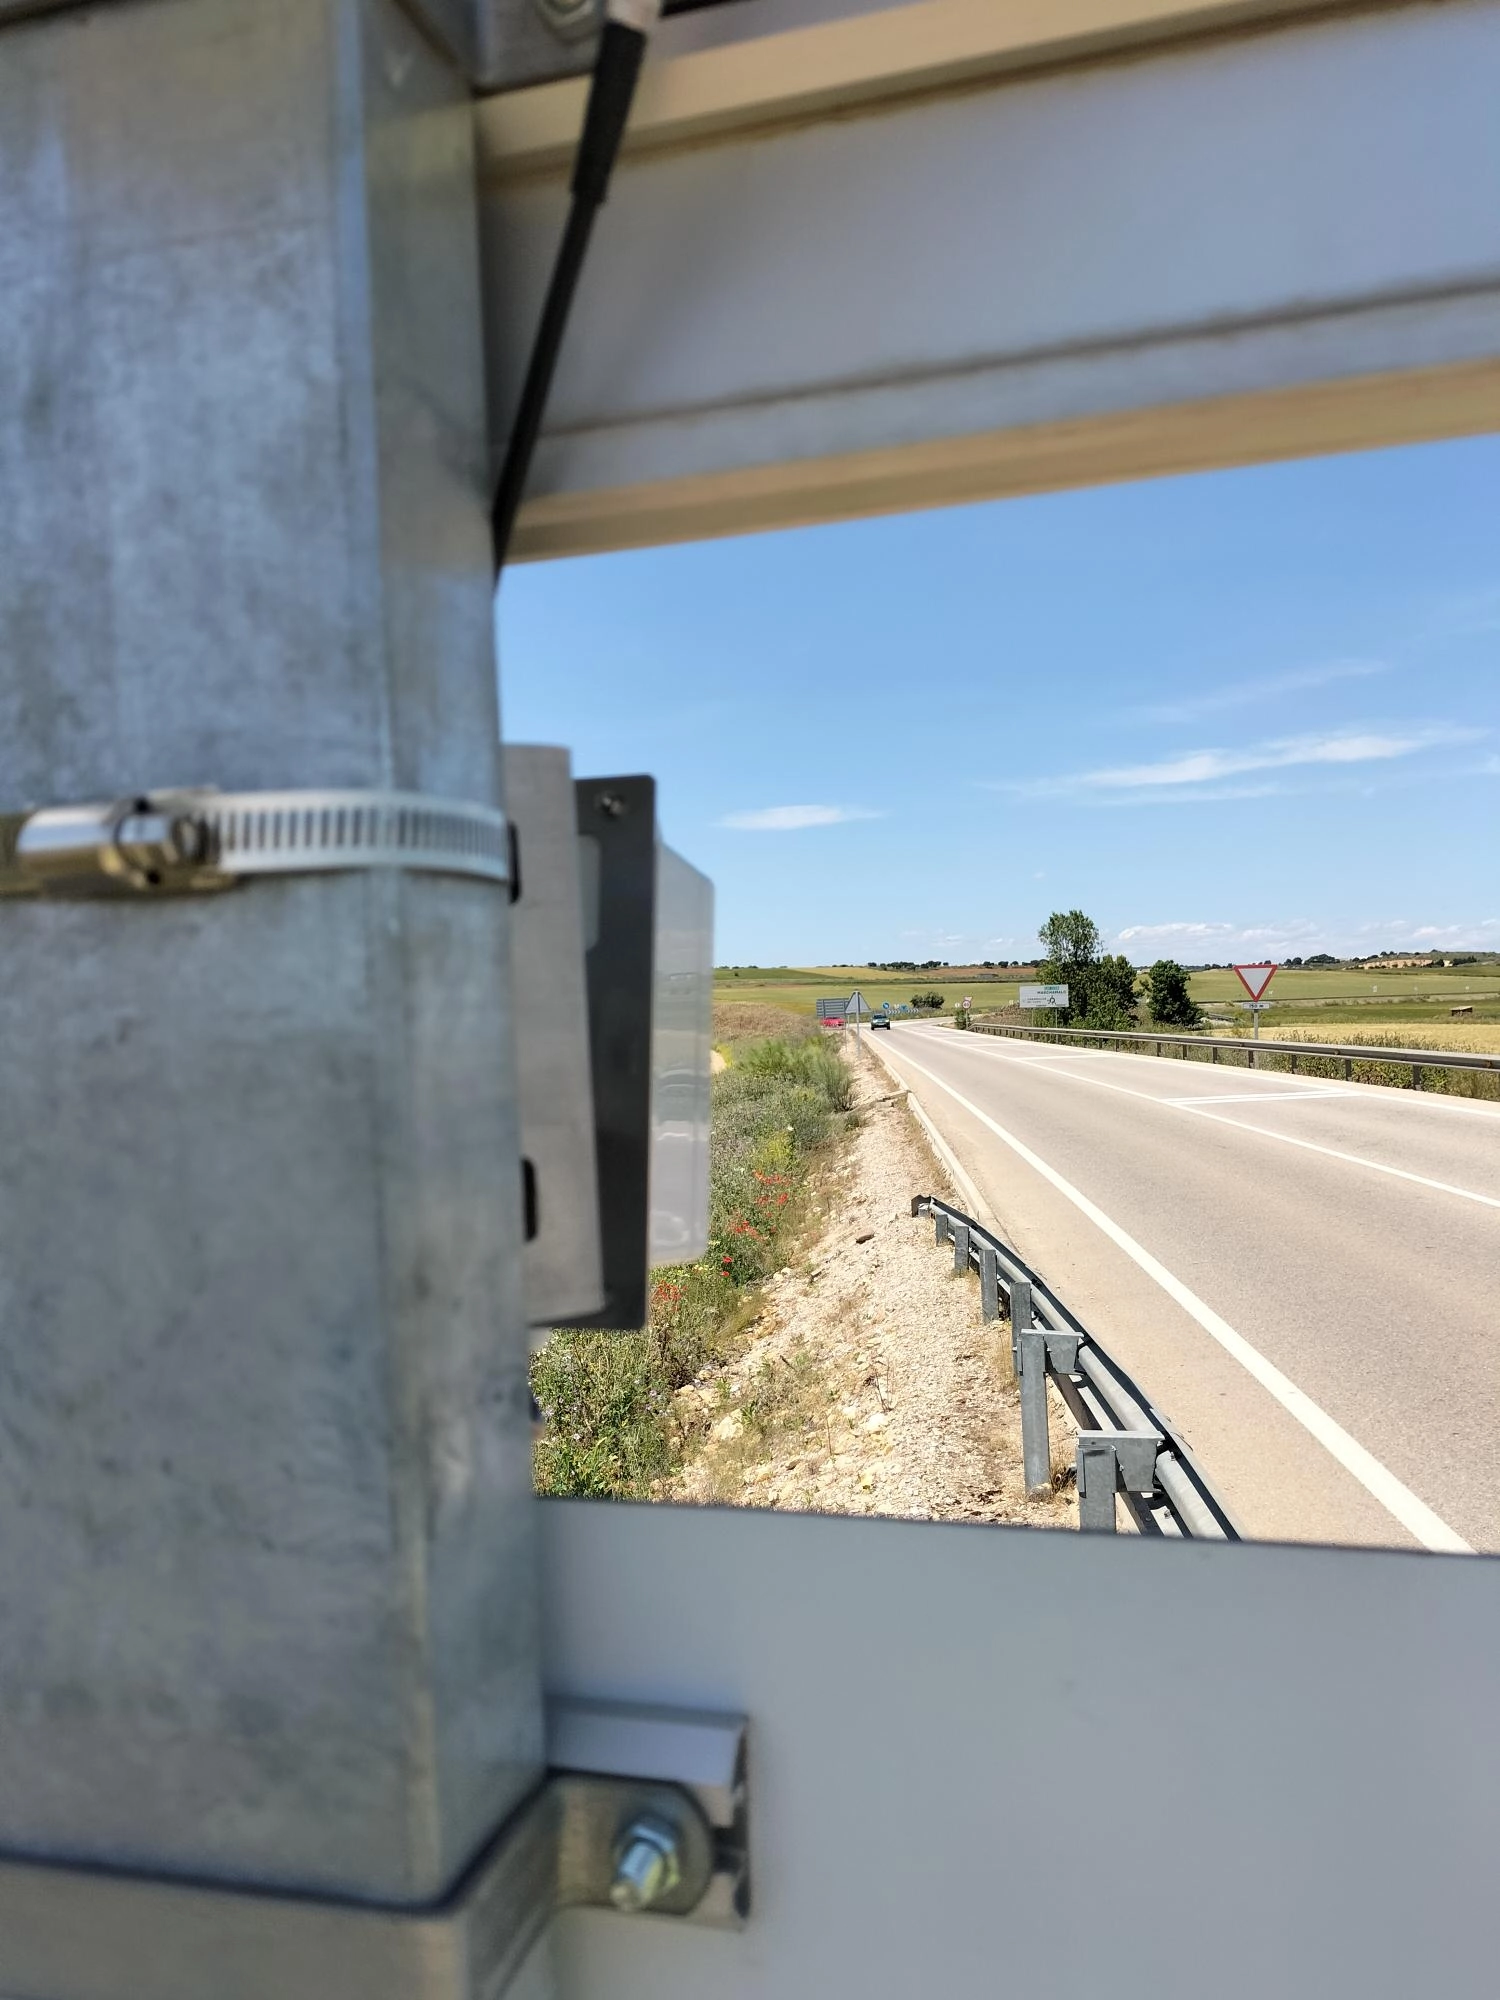
The mounting point governs data quality more than any other factor in the deployment.
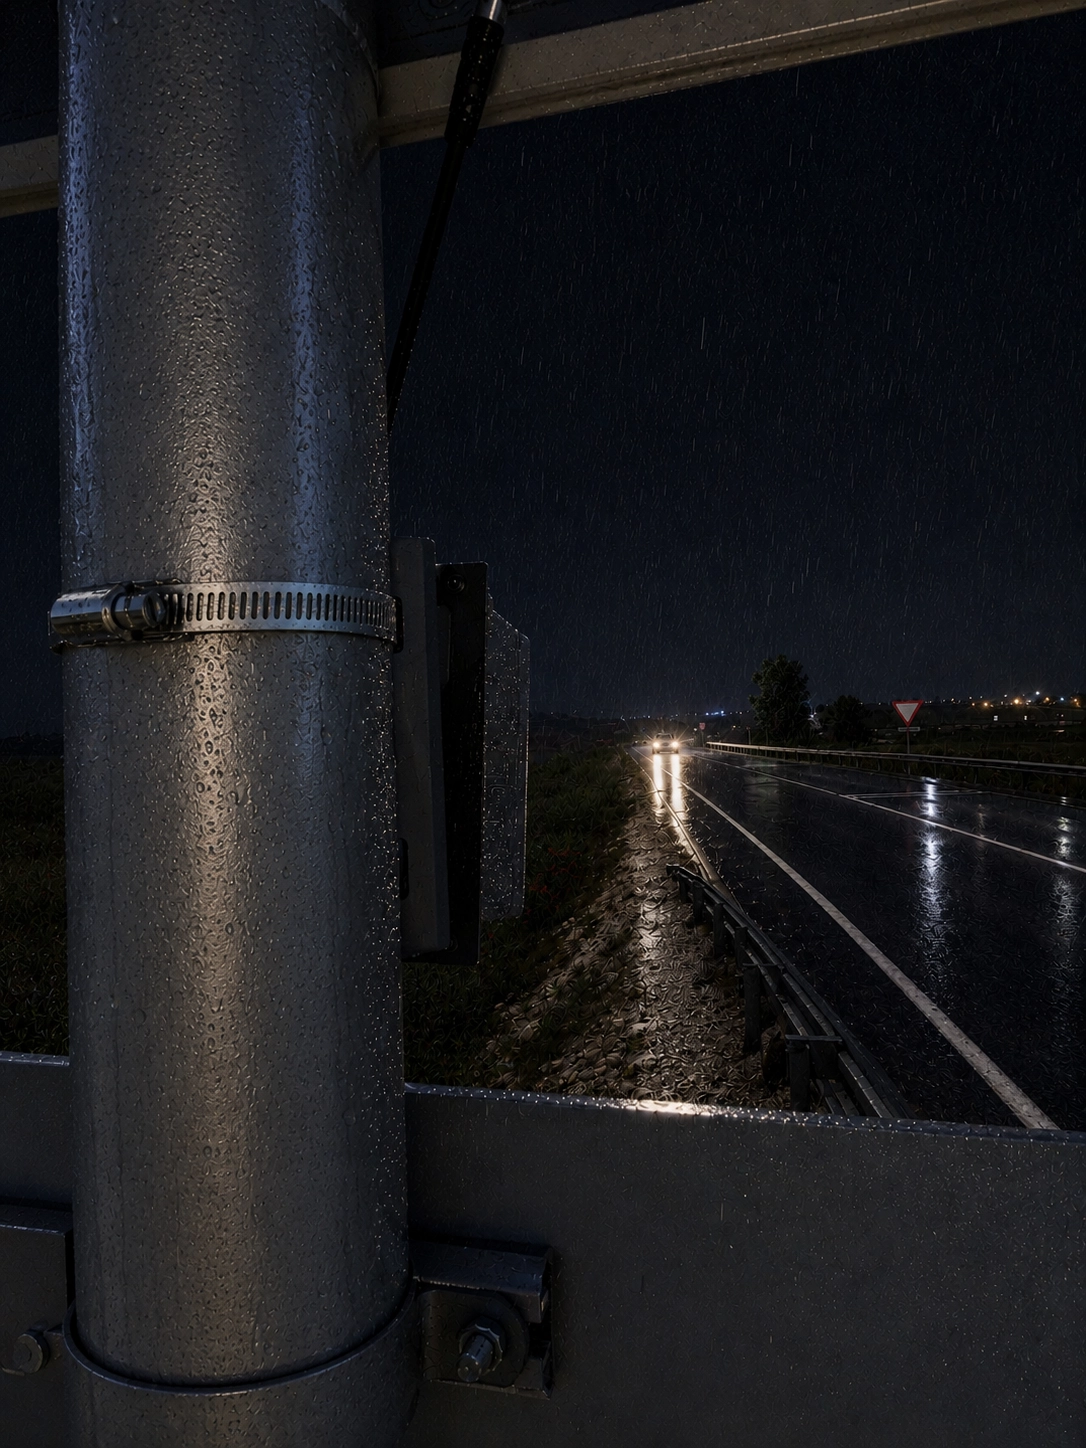
If the campaign is to be repeated later —for a before-and-after comparison, for example— it is worth documenting the installation: the support used, the height, the angle and the distance to the road centreline. Reproducing those conditions is what lets you attribute the differences to the scheme rather than to the deployment.
The unit measures every vehicle passage, and those records are aggregated into the indicators that go into the study.
Every vehicle crossing the measurement zone, with no cameras and nothing on the carriageway.
Each passage with its timestamp, aggregated by hour, day and direction across the period.
Comparable indicators and series, ready for analysis and for writing up the study.
The data available per passage depends on the model and configuration of the unit; the aggregated indicators depend on the platform or analysis tool you work with.
Tell us what data your report needs and we will confirm which unit and configuration deliver it.
Request a technical proposaluRAD Smart Traffic records every passage and generates a dataset you can use directly in your study or process with your own tools.
| timestamp | lane | direction | class | speed |
|---|---|---|---|---|
| 2026-05-12 08:31:24 | 1 | inbound | car | 42 km/h |
| 2026-05-12 08:31:39 | 2 | outbound | car | 47 km/h |
| 2026-05-12 08:32:02 | 1 | inbound | van | 38 km/h |
| 2026-05-12 08:32:15 | 1 | inbound | car | 44 km/h |
| 2026-05-12 08:32:51 | 2 | outbound | hgv | 31 km/h |
| 2026-05-12 08:33:07 | 2 | outbound | car | 49 km/h |
The values shown are illustrative and serve to show the structure of the file; they do not come from a real campaign. Agreeing in advance which fields, which granularity and which format the report needs avoids redoing work once the campaign is over; export and historical storage are handled by uRAD Smart Traffic.
This is the constraint that shapes a temporary survey most: it determines how many days you can measure and therefore what campaign you can propose.
With an accessible power point, autonomy stops being the main limit on the deployment: the campaign can run for 7, 15 or 30 days and be repeated with no energy intervention.
With no mains supply, the unit runs on an external lithium battery. It is the option for sites without a power point, with an operational limit worth bearing in mind when planning the study.
When power, storage and connectivity are correctly sized, the unit can operate unattended for the whole measurement period.
The equipment is bought once and travels with every study that follows. When a campaign ends, it is removed and moved to the next site.
Buying the equipment builds internal measurement capability and lets you decide when, where and for how long to measure without commissioning each campaign separately.
The same unit can move between locations and campaigns, or several units can run at once when the sites have to be measured simultaneously.
Tell us how many sites you need to measure and how many of them at the same time, and we will tell you how many units the deployment requires.
Request a technical proposalThe most frequent use of a temporary survey: measuring the same section twice to quantify the effect of a change to the road.
For the comparison to hold, the two campaigns must be equivalent in site, duration and configuration. Changing the position of the unit or the time window introduces differences that come from the survey design rather than from the scheme.
Temporary campaigns are delivered with uRAD Smart Traffic, the radar traffic counter for temporary surveys and permanent count stations. Choosing between its two versions comes down to connectivity at the site and how you want to collect the data.
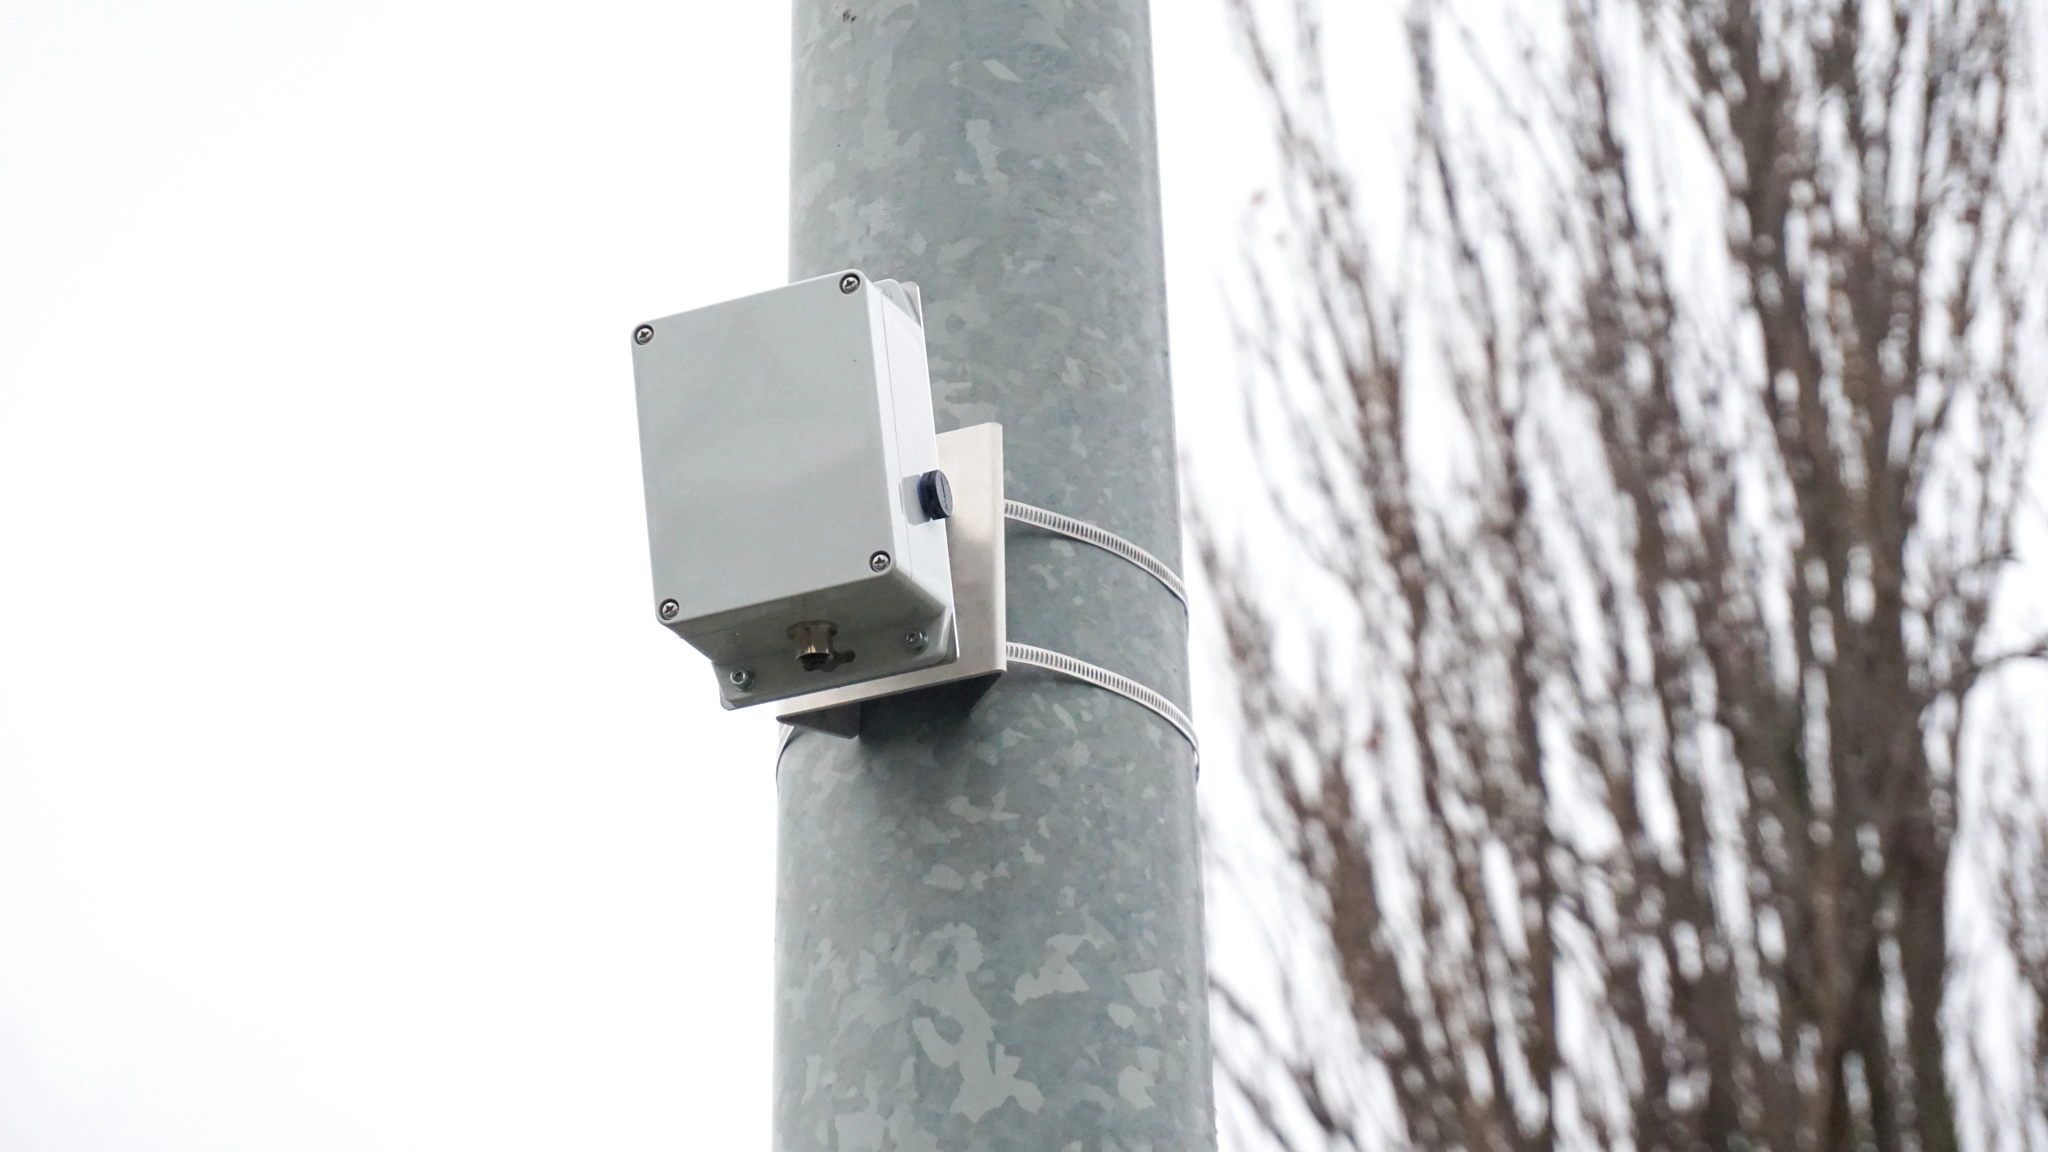
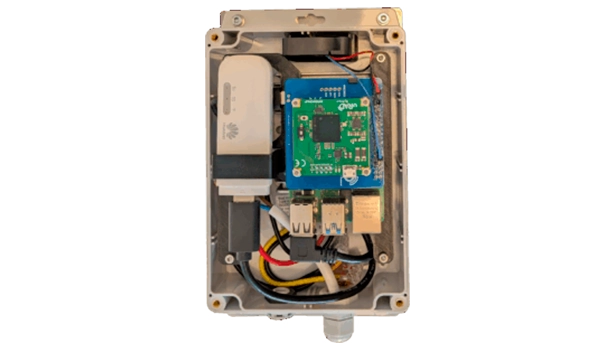
Tell us how the campaign will run and we will recommend the version, the configuration and the number of units that fit.
Request a technical proposalSee the Compact vs RPi technical comparison →
If all you need is to integrate radar detection and telemetry into your own hardware or software over RS-485 or UART, see uRAD Smart Radar Sensor.
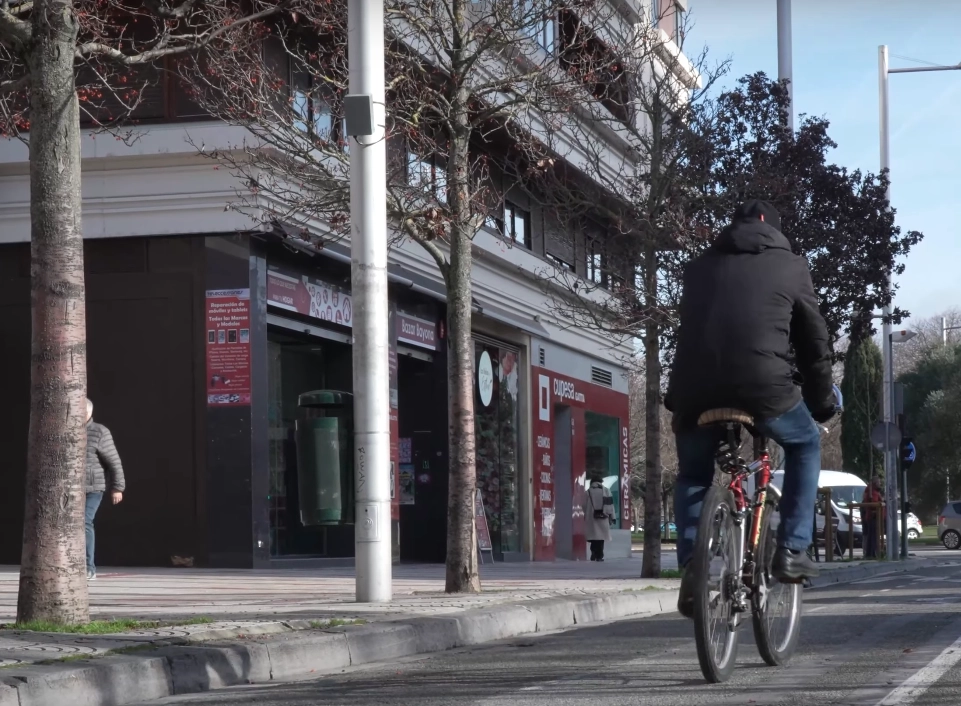
Different profiles, one shared requirement: defensible data over a bounded period.
uRAD Smart Traffic is currently sold, not rented. Buying it means the same unit can be used across different campaigns and survey sites, keeping the configuration and the methodology consistent between studies. Give us the details of your campaign —duration, number of sites and how many run simultaneously— and we will tell you which version and how many units fit.
The criterion is connectivity at the site and how you will collected the data Compact where low power consumption and direct integration matter most, and RPi model where local storage and later download are preferable. The full technical comparison is on uRAD Smart Traffic.
Yes. It is common to deploy several units on different sections over the same period to compare sites against each other, keeping installation and configuration criteria consistent so the series remain comparable.
Through an initial field validationat the start of the period. You review the geometry of the site, the position, height and angle of the unit, the paths vehicles take and any occlusions that could leave passages unrecorded. The first records are then checked against what is observed on the section. Once validated, the configuration must be kept stable for the whole campaign: any change of position or of parameters breaks the comparability of the series.
Tell us how your campaign will run. We will review the survey sites, the duration, the power supply and the data you need, and recommend the right equipment and configuration.
Fields marked with * are required. We respond within 48 business hours with a recommendation for equipment, configuration, and next steps.
If you are still framing the project, these pages settle the decisions that come before choosing equipment.