
A good fit if you need
- Counting without roadworks on existing infrastructure
- Counting by lane and direction
- Classification and speed per pass
- Historical data for mobility studies
- Integration with your own platform or uRAD Cloud
Count vehicles, bikes and pedestrians by lane, direction, category and speed. Build a continuous historical record and deliver the data over CSV, REST API, MODBUS or uRAD Cloud, with no cameras and no work on the carriageway.
Deployed by the Pamplona City Council: eight counting points recorded 2.7 million cyclist passes in a year, integrated into its municipal platform.
uRAD Smart Traffic
Choose Smart Traffic when you need traffic counting, classification, historical data, statistics, reports or data integration for mobility studies and infrastructure management.
uRAD Smart Radar Sensor
Choose Smart Radar Sensor when you need to detect presence, approach, speed or direction and communicate a real-time event to a panel, beacon or controller.
Smart Traffic is designed to record, store and exploit mobility data. It is not an enforcement system, a video camera or a sensor meant to trigger signals.
Each pass becomes a structured record that can be stored, analyzed or integrated.
The available metrics depend on the model, the configuration and the platform version.
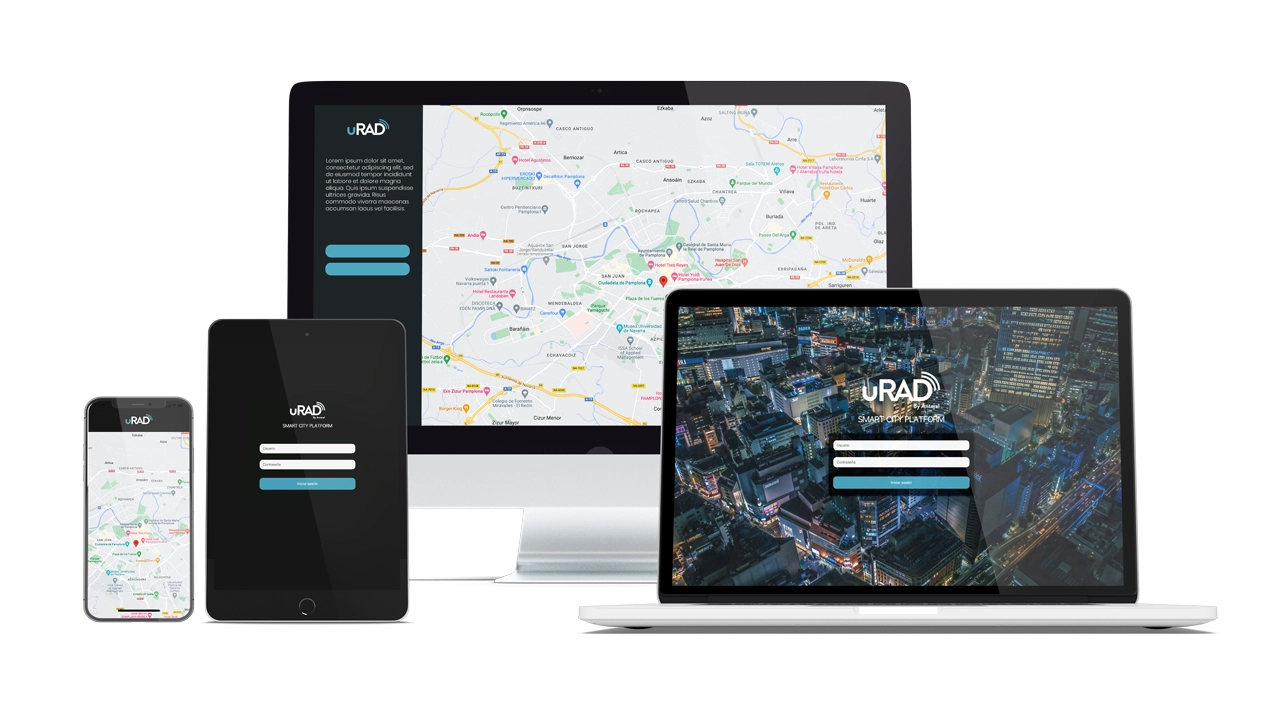
Connect your counting points to uRAD Cloud to review traffic evolution, compare locations and download the information from your browser.
 Pamplona
Urban counting
Pamplona
Urban counting
Record traffic volume, category distribution, directions and speeds on streets, avenues or urban accesses.
Enables: analyzing where flows concentrate and how mobility evolves.
 Temporary studies
Deploy temporary points to compare the situation before and after lane changes, traffic calming, works or new routes.
Enables: measuring the real impact of an intervention.
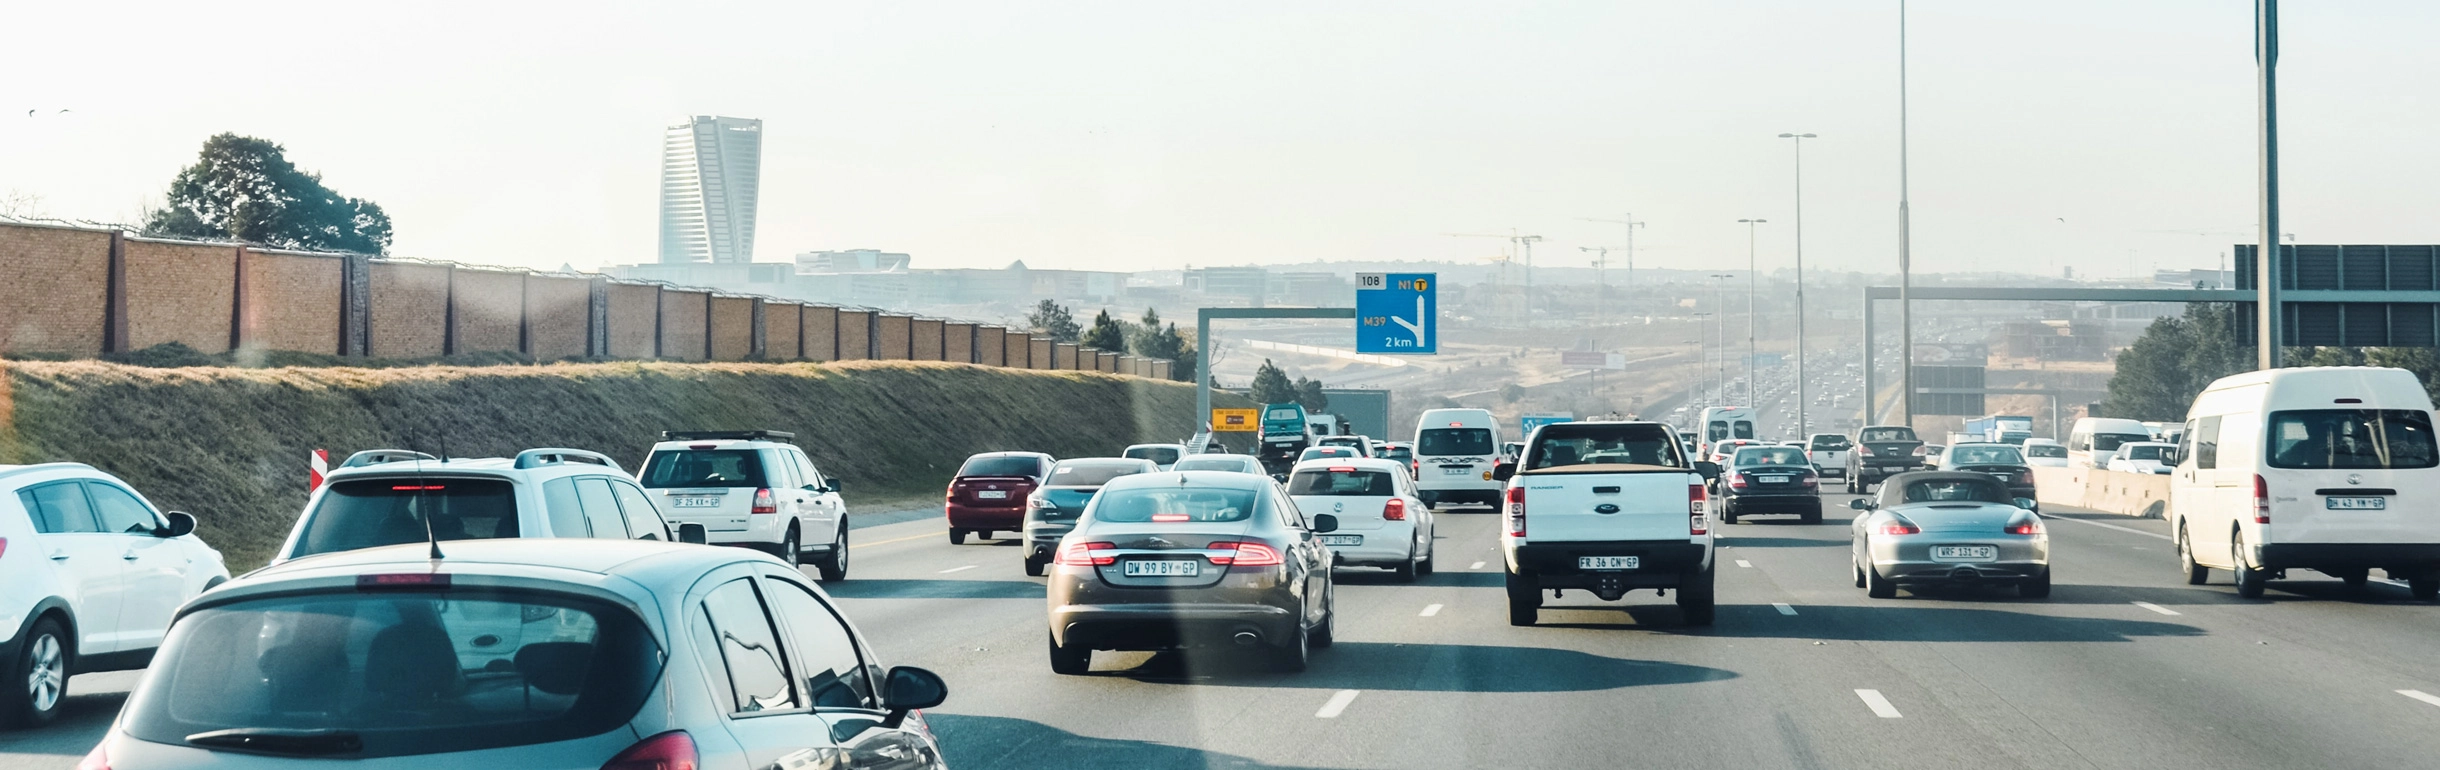 Highways & infrastructure
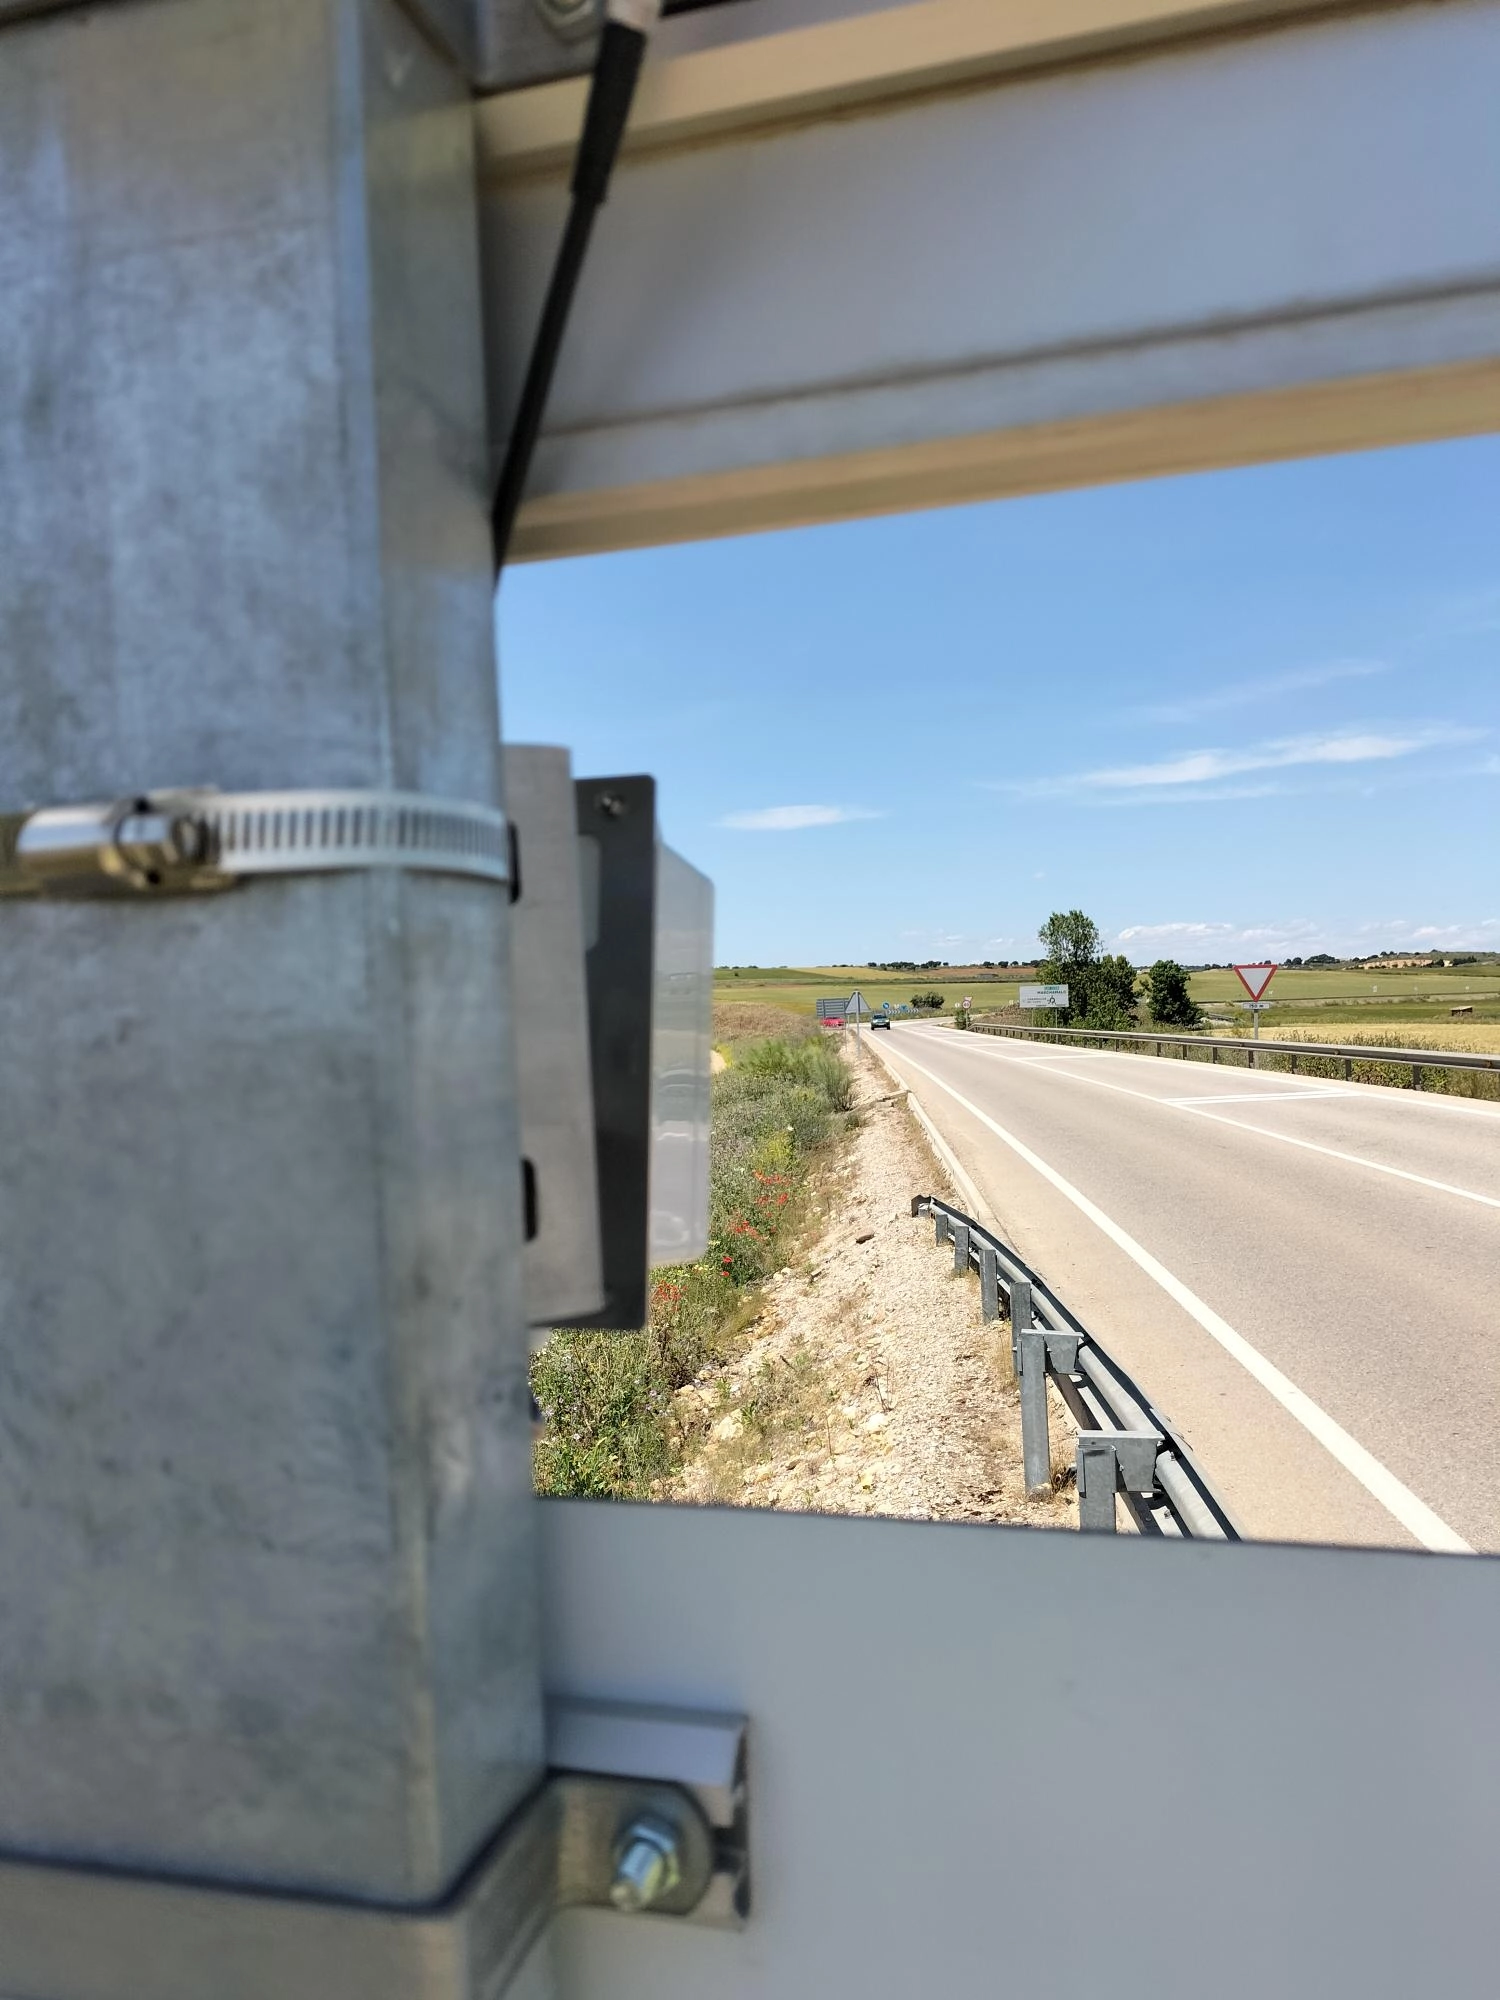
Record volume, category, direction and speed to analyze the use of secondary, regional roads or strategic accesses.
Enables: prioritizing maintenance, planning and capacity management.
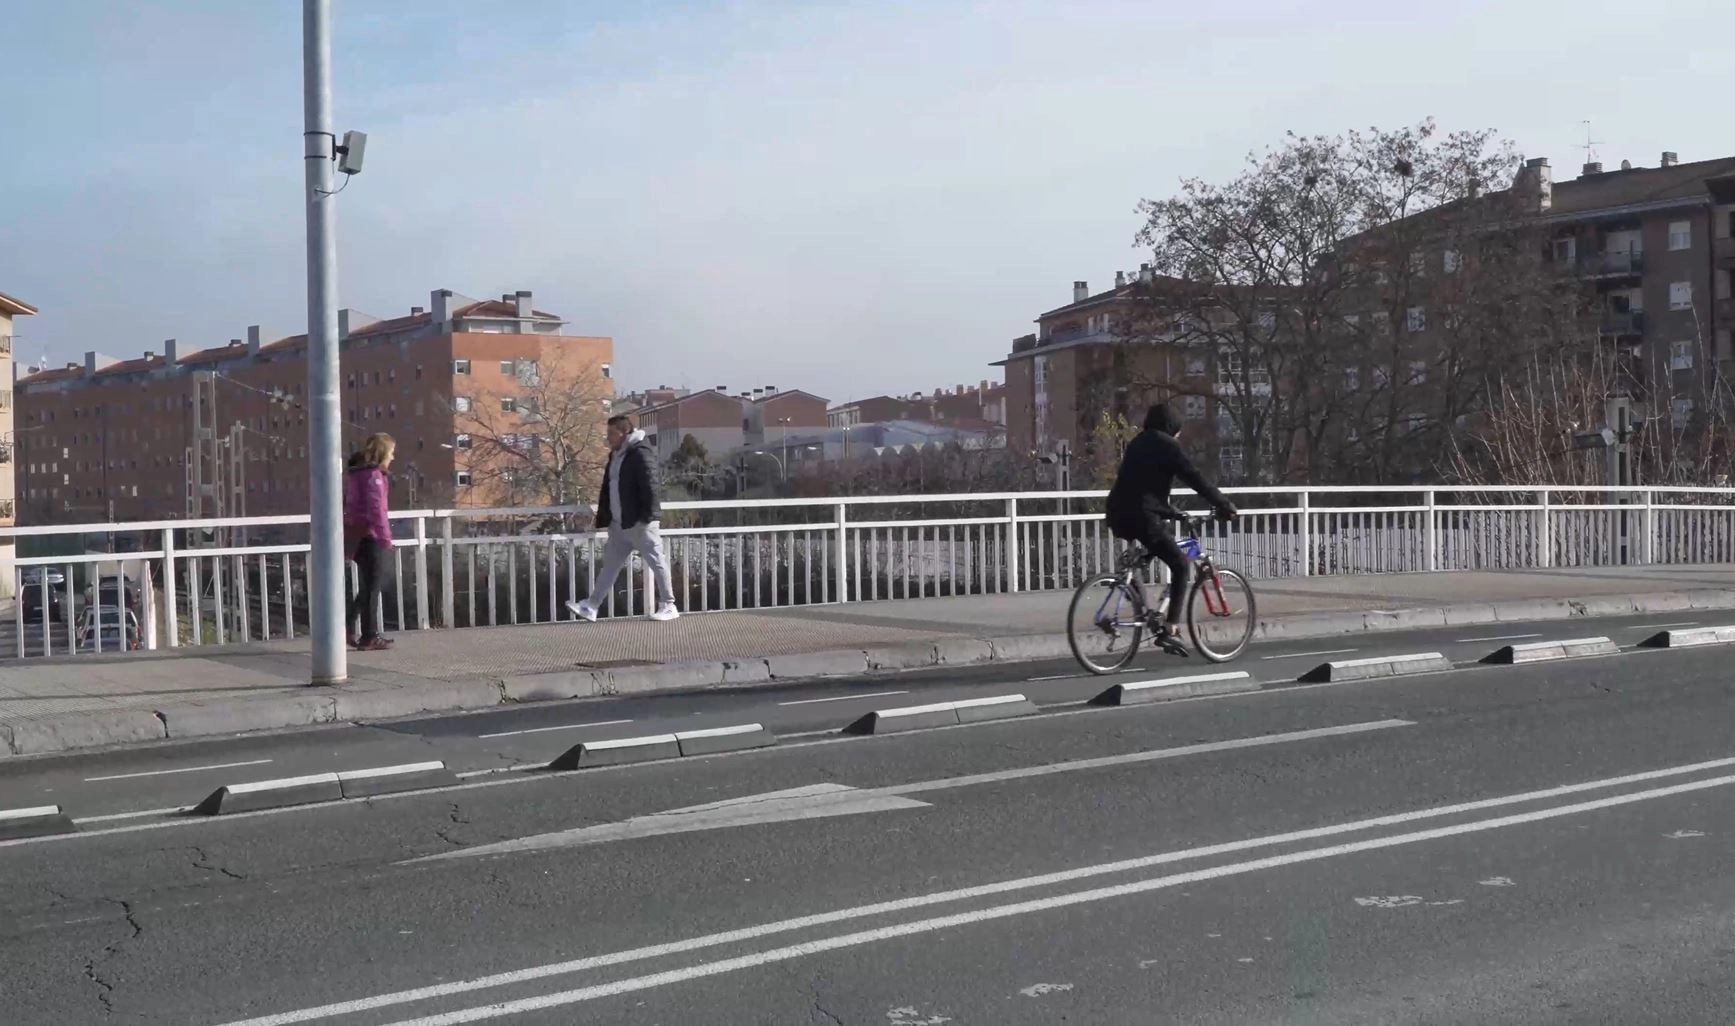 Pamplona
Active mobility
Pamplona
Active mobility
Perform bike counting, PMV counting and pedestrian counting by direction and time of day, with time evolution and without using cameras.
Enables: sizing and evaluating investment in active mobility.
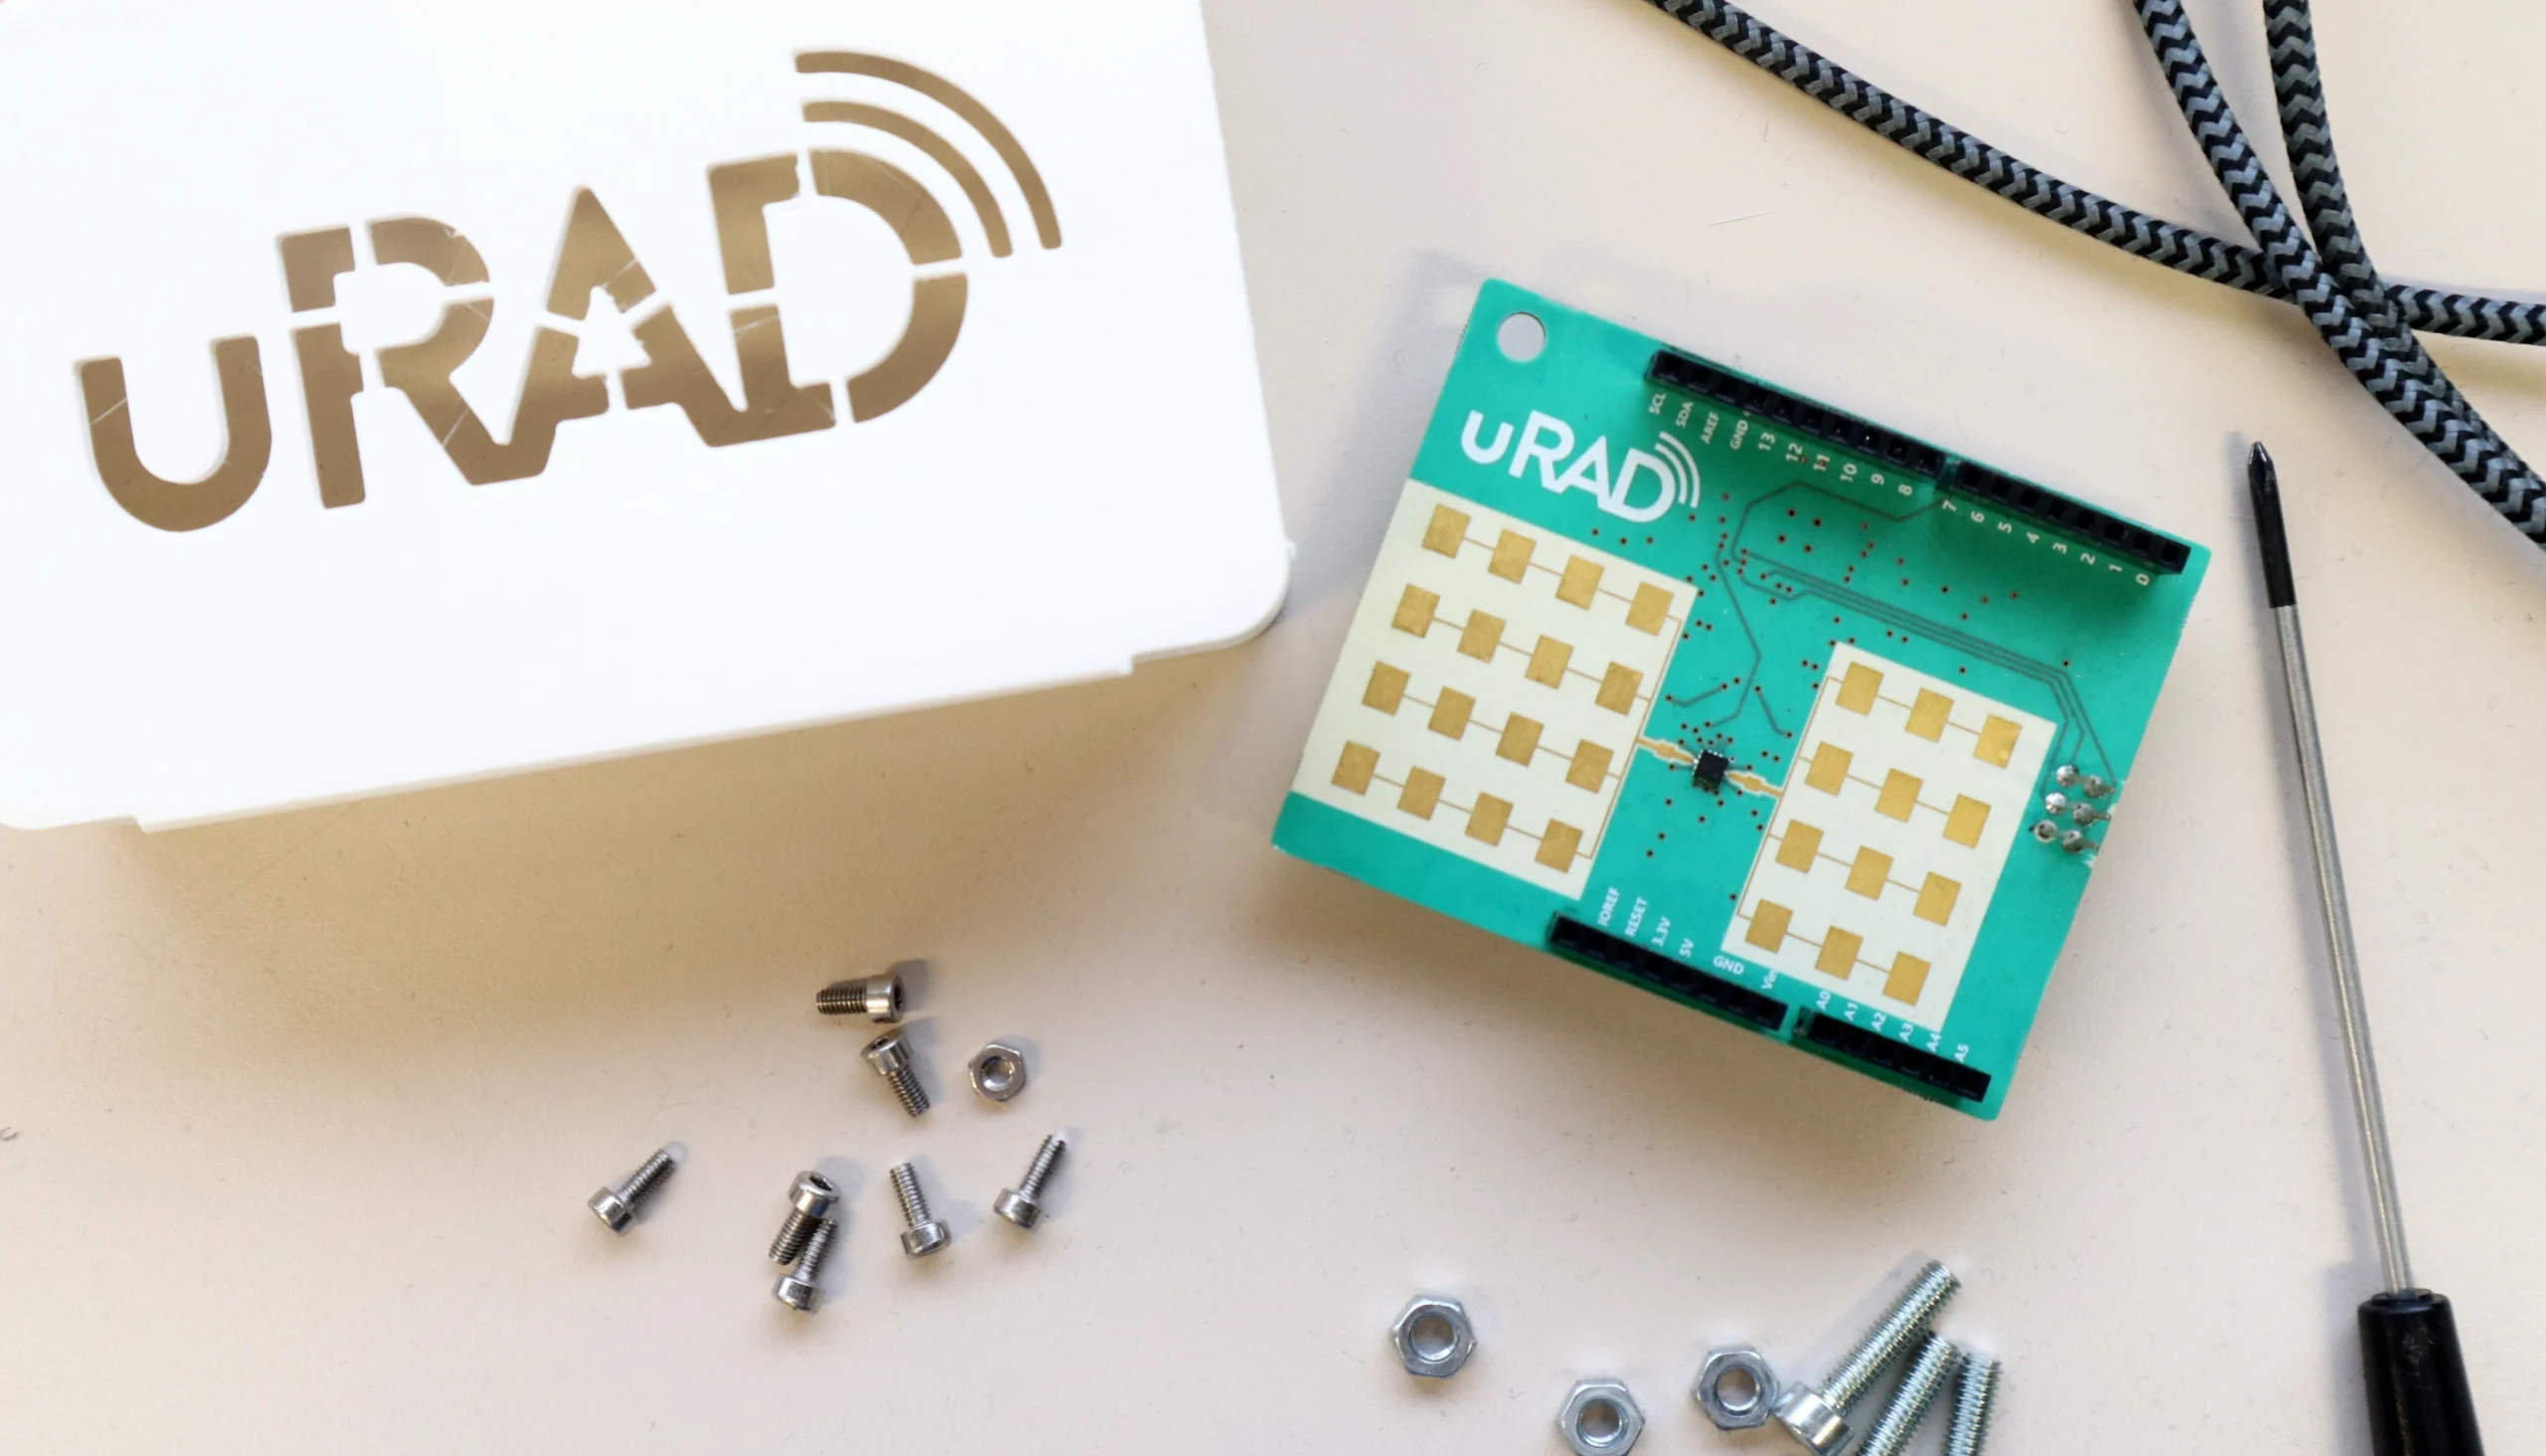 Smart City integration
Integrate the counter's information with an urban platform, a control center or an existing mobility system.
Enables: centralizing and comparing information from different points.

Eight counting points record the cycling network's mobility and deliver the data for municipal analysis and integration, with no roadworks and no cameras.
In validated configurations and installations, Smart Traffic can exceed 95% counting accuracy. Real performance depends on road geometry, height, angle, lanes, density, user type and possible occlusions.
Radar technology is less dependent on visible lighting than image-based systems; performance is validated for each installation.
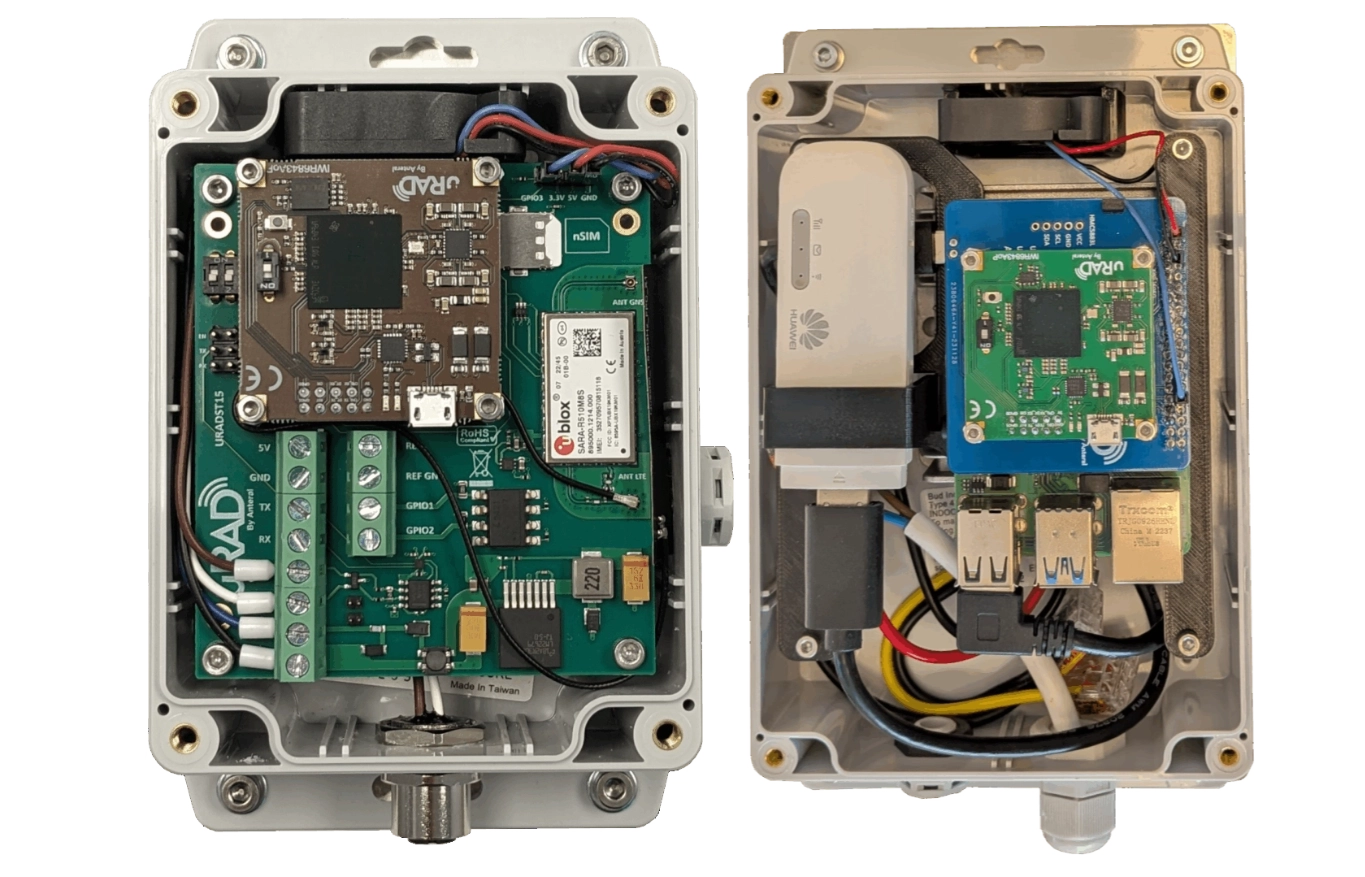
The same radar core in two configurations. Choose by data flow and project type.
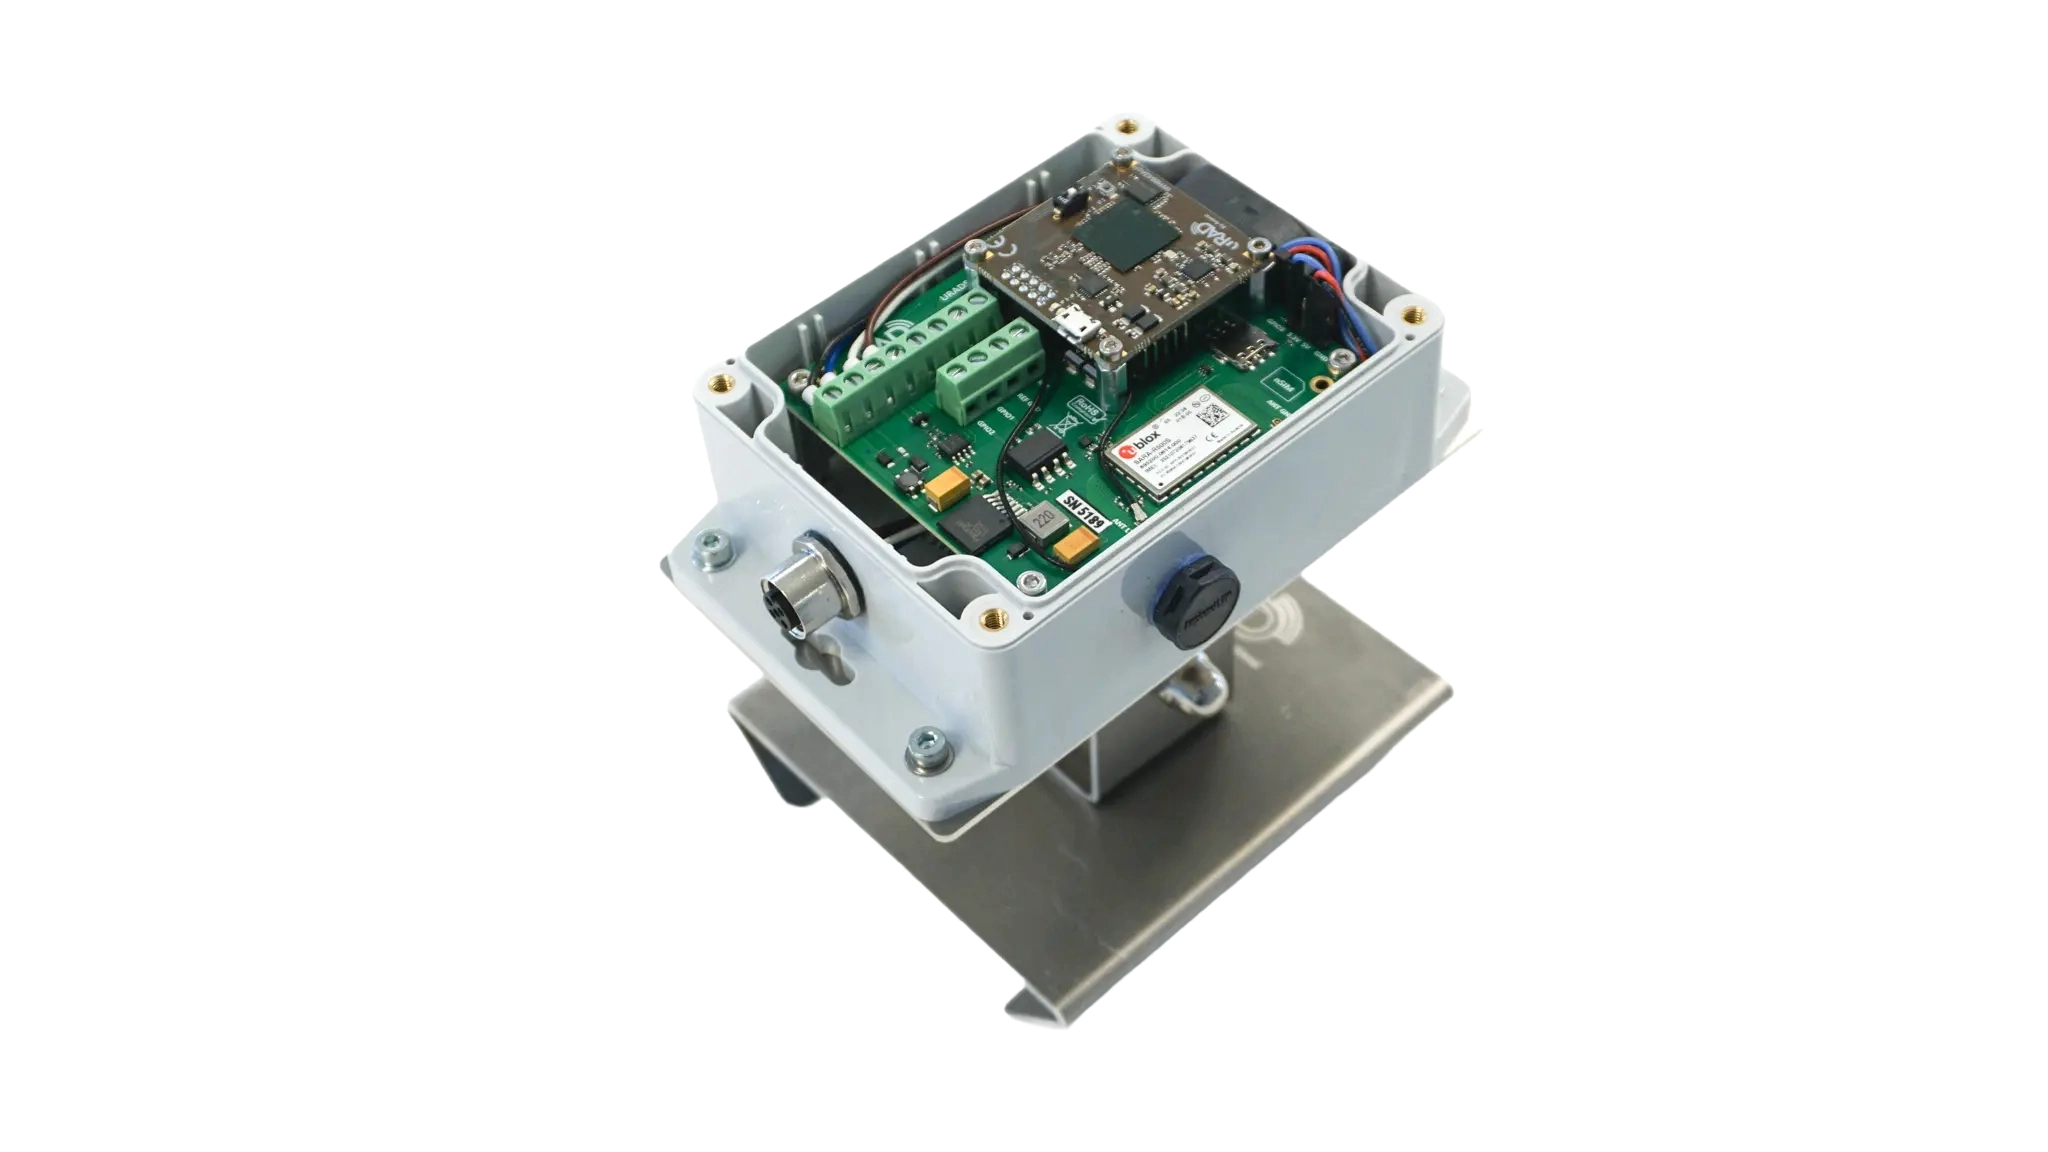
Compact counting unit for direct integration of data over MODBUS or REST API, with optional connectivity. No full local historical storage.
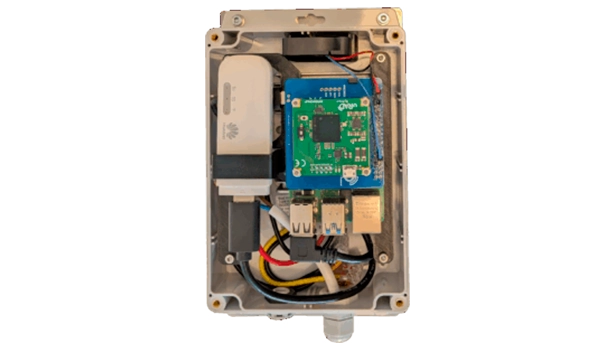
Counter with local processing on Linux and on-board historical storage, with greater integration flexibility and suitable for intermittent connectivity.
| Feature | Compact | RPi model |
|---|---|---|
| Sistema operativo | Embedded firmware | Linux (Raspberry Pi OS) |
| Power | 8–42 V DC (5 V DC opt.) | 8–40 V DC · or · 110–240 V AC |
| Power consumption | 2,5 W | 4,5 W |
| Communication | MODBUS RS-485 · WiFi · 4G LTE-M opt. · LoRaWAN opt. | WiFi · 4G |
| Range | 30 m (classification) · ±15 m lateral | 30 m (counting) · 100 m (other) · ±15 m lateral |
| Lanes | Up to 4 (3 per direction) | Up to 4 (3 per direction) |
| Protection | IP66 · NEMA 4X/12/13 · UL-508 | IP66 · NEMA 4X/12/13 · UL-508 |
| Data delivery | uRAD Cloud platform · or · your platform via API / MODBUS | |
Datasheets and user manuals for each model to review specifications, installation and integration.
It counts vehicles, bikes and pedestrians and classifies them into categories (regular, medium, long, bike and pedestrian) by lane and direction. A single counter covers up to 4 lanes depending on the installation; the real number and granularity depend on the height and geometry of the road.
For each pass it records date and time, lane, direction, category and speed. Speed is stored as data that is kept and analyzed —averages, distributions and evolution—, not as a condition to trigger a system. The range and resolution are confirmed according to the model and installation.
The RPi model stores the historical record on the device itself, so the data is preserved even if connectivity fails temporarily and syncs on recovery. The Compact has an internal buffer; for sites with intermittent coverage RPi is worth considering. The exact capacity is confirmed in the technical assessment.
Through documented interfaces: CSV, REST API and MODBUS, or a connection to uRAD Cloud. The purpose is to integrate and exploit the data in your platform, control center or existing mobility system, without depending on a single tool.
Compact is a compact unit for direct data integration over MODBUS or REST API. RPi adds local processing on Linux and on-board historical storage, with greater integration flexibility and suitability for intermittent connectivity. The choice depends on connectivity, storage and project type.
In validated configurations and installations, counting accuracy can exceed 95%. It depends on height, angle, lanes, density, user type and occlusions; counting accuracy, classification accuracy and speed resolution are estimated separately for each counting site.
Yes. It is radar, not a camera: it does not capture identifiable images of people or license plates. It enables counting bikes, PMVs and pedestrians as flows that are counted and analyzed by direction and time, with the installation technically validated for each user type.
uRAD Smart Traffic counts, classifies, stores and analyzes movements to build historical data and statistics. Smart Radar Sensor detects presence, approach, speed or direction and communicates a real-time event so a panel, beacon or controller can act.

We'll review the location, the lanes, the user types, the installation, the connectivity and the data destination to recommend the right model and configuration.