
Pass event and lane
Detection of each vehicle and the lane it travels in as it passes the measurement point.
Compare radar, cameras, inductive loops, pneumatic tubes, Bluetooth/WiFi and manual counting by available data, installation, privacy, maintenance and integration.
A general guide for urban mobility, road, industrial-area and Smart City projects.
For temporary survey campaigns , they can be enough.
For visual identification or licence plates (LPR).
For permanent in-road installations.
For continuous counting with no cameras and no civil works.
A vehicle counting and classification system is a set of sensors and software that detects the vehicles passing a point on the road, counts them and groups them by type. Depending on the technology, it can add information on speed, direction of travel, lane and occupancy.
This data characterises how a road behaves over time: analysing peak hours, calculating annual average daily traffic and providing objective information for urban planning and mobility management.
When the goal is to measure traffic volumes and passage patterns, these measurements form part of a traffic count or traffic survey.
This guide explains the main vehicle counting and classification technologies and how to choose between them. For models, specifications and radar-based installation, see the uRAD Smart Traffic.

A vehicle classifier system detects road users as they pass a measurement point and assigns them to defined categories for traffic analysis. In many projects, classification is combined with vehicle counting and, depending on the sensing technology and project configuration, data such as speed, direction of travel and lane.
Radar, cameras, inductive loops and pneumatic tubes use different sensing methods, so the level of classification detail, installation requirements and maintenance needs vary by technology. The right option depends on the categories that must be distinguished, whether the deployment is temporary or permanent, the road geometry and how the data will be integrated.
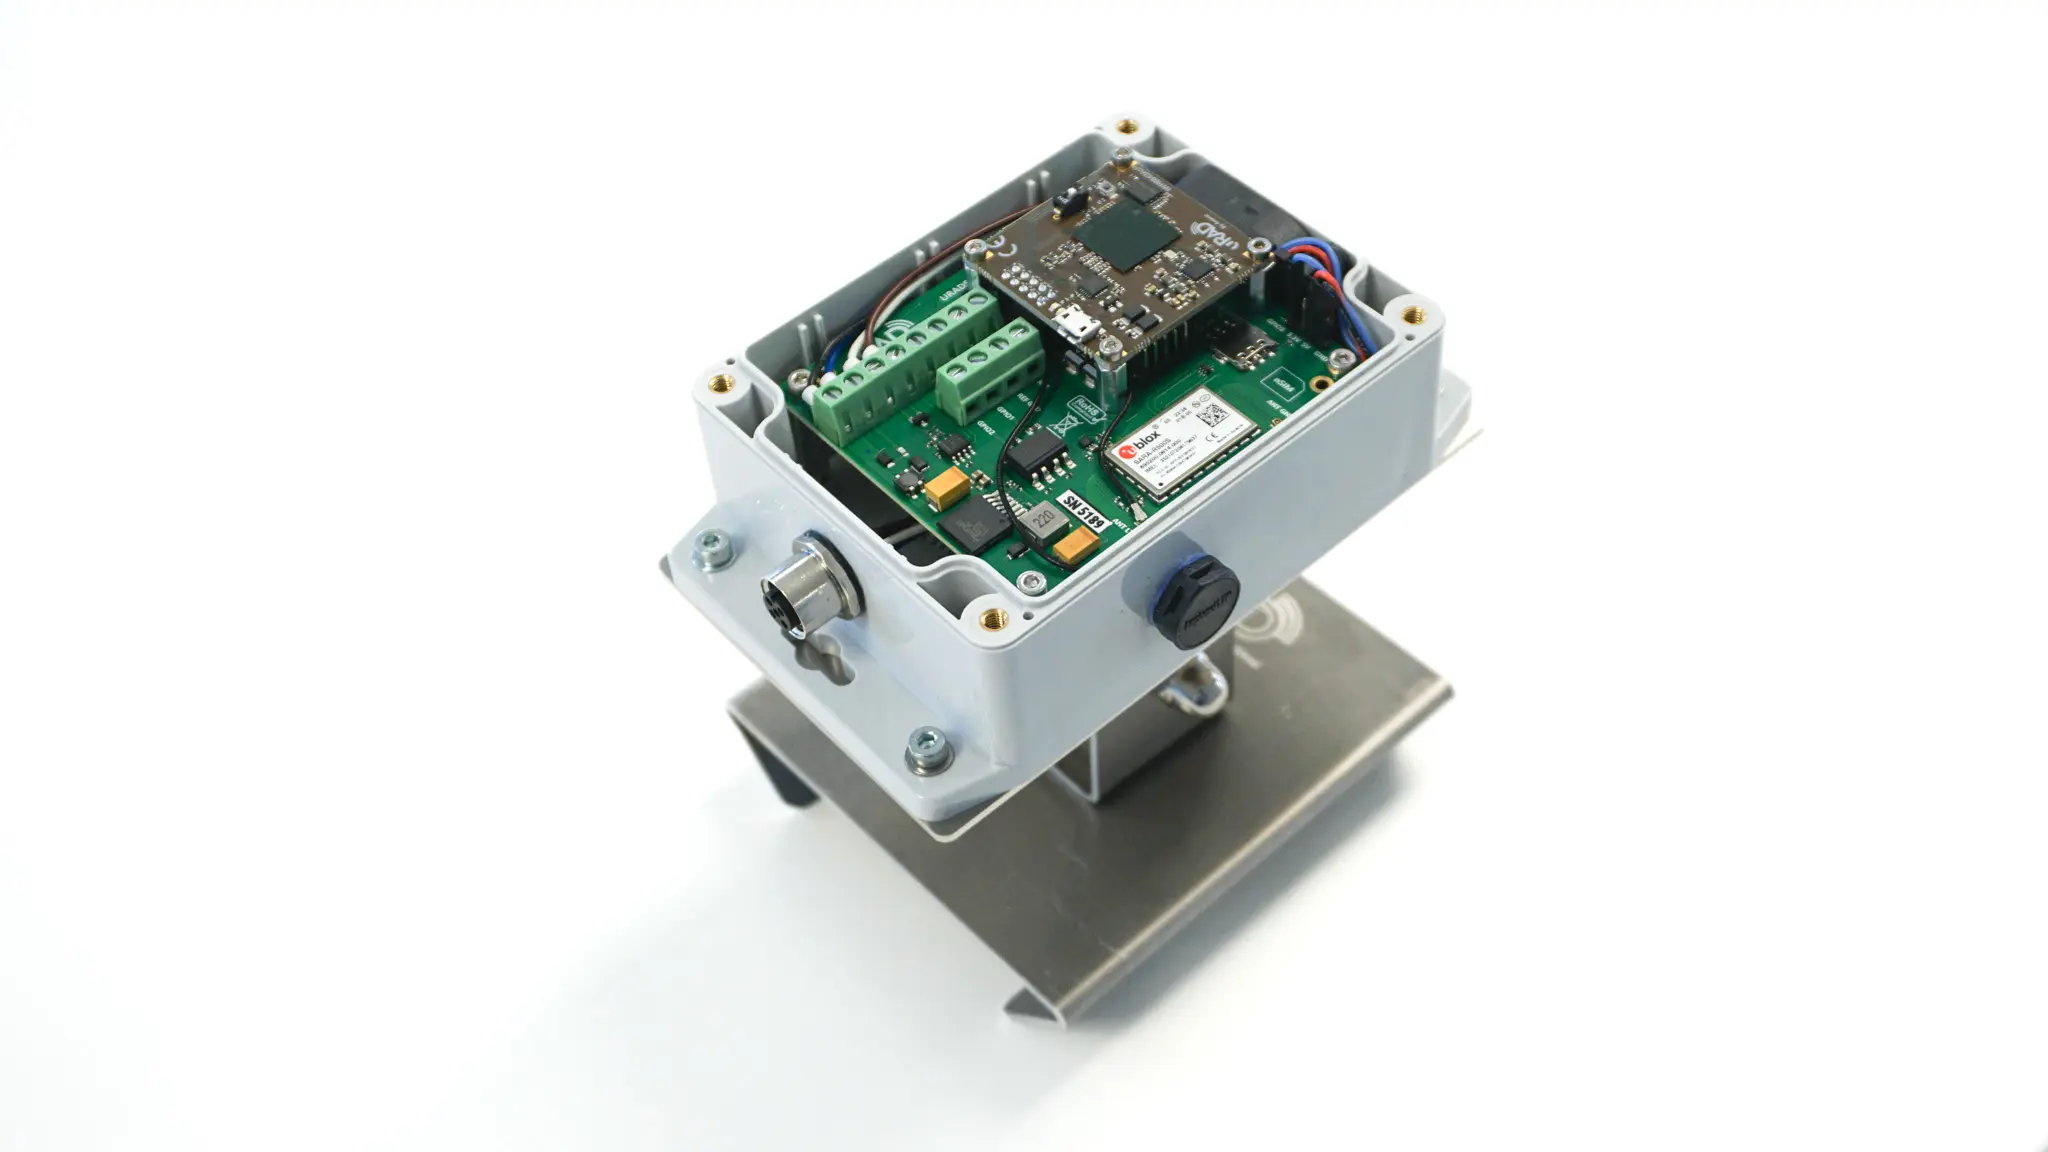
If the project requires continuous camera-free counting and classification, see the uRAD Smart Traffic radar counting solution.
Whatever the technology, the system turns pass events into structured data for analysis, planning or integration with external platforms.
Depending on the technology and project configuration, a counting and classification system can provide different types of information.
Information the sensor captures on each pass event.
Detection of each vehicle and the lane it travels in as it passes the measurement point.
Distinguishes vehicles approaching from those moving away from the measurement point.
Speed of each vehicle or section average, depending on the technology used.
Grouping by type: pedestrian, bicycle, light or heavy vehicle.
Metrics derived by aggregating and analysing the captured events.
Aggregated traffic volume that helps size the road.
Demand curves across the day and identification of traffic peaks.
Comparison of volumes across days and weeks to spot trends.
Degree of road saturation to anticipate and manage congestion.
Each technology offers a different trade-off between the data it provides, privacy, installation and maintenance. This is a balanced overview.
Emits radio waves and measures the reflected signal to detect presence, distance, speed and direction without capturing personal images.
Process images to detect and classify vehicles, with licence-plate reading depending on the system.
Coils embedded in the pavement that detect a vehicle’s metallic mass as it passes.
Tubes across the road that record axle passes via air pulses.
Staff who count and classify vehicles visually, on site or from video.
Detect on-board devices to estimate flows and travel times. It is a complementary technology, not direct counting and classification.
A guide overview placing each technology by its best use, strengths, limitations, privacy and installation.
| Technology | Best use | Benefits | Limitations | Privacy | Installation |
|---|---|---|---|---|---|
| FMCW Radar | Continuous counting with speed and direction | Day/night, weather-robust, low maintenance | Sensitive to geometry and occlusions | No personal image | Non-invasive, no civil works |
| Cameras | Visual classification and license plate | Rich data, visual verification | Affected by lighting, optics and weather depending on the system | Image capture | Medium, requires calibration |
| Inductive loops | Permanent counting at a fixed point | Mature and reliable per lane | Civil works and resurfacing | No image capture | Invasive (road opened) |
| Pneumatic tubes | Temporary traffic counting campaigns | Fast and low-cost | Wear; not for dense traffic | No image capture | Temporary on the road |
| Manual counting | One-off studies / validation | Flexible human judgement | Not continuous, staff cost | No automatic recording | No fixed installation |
| Bluetooth / WiFi | Travel times and O-D | Network-level view, easy to deploy | Complementary: does not count or classify exhaustively | Subject to minimisation and pseudonymisation | Simple, on existing infrastructure |
Guide table: the real performance of each technology depends on the manufacturer, model, configuration and conditions at the measurement point. Field validation of the data is recommended.
Radar can be especially useful where continuity, privacy and non-invasive installation are priorities.
If the project needs visual identification or licence plates, a camera may be right. If the goal is counting, speed and direction without capturing images, radar is usually an option worth considering.
In urban projects, image processing can be a relevant factor. Technologies that capture no images, such as radar, present a different privacy profile from video-based solutions.
Compliance always depends on the applicable regulation, on how data is processed and on the specific configuration of each project. This page does not constitute legal advice.
This checklist helps scope the project and prepare a feasibility enquiry or quote request.
No system is perfect in every scenario. Knowing these factors helps plan realistic deployments and interpret the data well.
Accuracy does not depend on the technology alone. Sensor position, road geometry, lane spacing and occlusions all affect the result.
Poor mounting affects the covered area and lane separation.
Curves, gradients and width shape detection and classification.
Congestion can make it harder to separate vehicles close together.
Large vehicles can hide smaller ones behind them.
Street furniture or parked vehicles can add noise to the signal.
Unstable masts or poles can affect measurement quality.
Very adverse conditions can affect results to varying degrees by technology.
Initial setup is key to ensuring the expected accuracy.
Results should be checked against reference measurements.
In practice, the real accuracy of any system requires field validation and depends on the configuration and the specific environment of the measurement point.
Different contexts have different data needs; the right system depends on the goal of each project.
Objective data to manage urban traffic and prioritise actions.
Counting integrated into urban platforms for data-driven decisions.
Characterising volumes and speeds on interurban roads.
Access control and heavy-vehicle monitoring in logistics.
Counting at entries and exits of high-turnover facilities.
Bicycle counting y usuarios vulnerables para dimensionar y evaluar carriles bici.
Temporary traffic counting campaigns para medir el impacto de una actuación.
Evidence to size road infrastructure.
If, after comparing technologies, you need continuous counting with no cameras and no civil works, a radar solution may fit. uRAD Smart Traffic brings together models, capabilities, technical documentation and integration for real projects.
 uRAD Smart Traffic traffic radar
It is a combination of sensors and software that detects road users passing a point on the road, counts them and groups them by type (pedestrian, bicycle, light, heavy), and can add speed, direction and lane. The data is used for mobility planning, traffic management and smart city projects.
It detects road users at a measurement point and uses the sensor signal and processing logic to assign each pass to a category. The detail available depends on the technology, installation and project configuration. Classification can be combined with counting and, in some systems, speed, direction and lane data.
Counting focuses on counting and classifying vehicles. Surveying is a broader concept that also includes analysing volumes (AADT), hourly patterns, occupancy and speed to characterise how the road behaves over time.
The most common are FMCW radar, cameras with video analytics, inductive loops, pneumatic tubes, manual counting and Bluetooth/WiFi sensors. Each offers a different trade-off between data, privacy, installation and maintenance.
The radar captures no personal images, works day and night and is more stable in rain or fog. Cameras add visual detail and licence plates, but involve image processing and depend on lighting. The choice depends on the project goal.
Yes. Technologies such as radar can classify by length or type (pedestrian, bicycle, light, heavy) without capturing personal images. The level of detail depends on the technology, the configuration and the conditions at the measurement point.
Depending on the technology: counting per lane, direction, speed, classification by type, annual average daily traffic, hourly patterns and occupancy, integrable into ITS, IoT or Smart City platforms.
Radar tends to be preferable when you want to avoid civil works, measure speed and direction, work 24/7 without depending on lighting and reduce maintenance. Loops require opening and replacing the road surface, though they remain valid for permanent installations.
The sensor position and height, road geometry, dense traffic, occlusions, static objects, mount vibration and weather. That is why calibrating and validating the data in the field is recommended.
Yes. Many systems offer standard outputs and protocols to integrate with ITS, IoT and Smart City platforms, allowing data to be centralised and used for traffic management and urban planning.
It helps to define the type of deployment, number of lanes and directions, whether classification and speed are needed, whether civil works are allowed, privacy requirements, power and connectivity, desired integration and environmental conditions. With that you can check your project’s feasibility.
Camera-free radar counting
Whether you want to compare technologies or assess a specific road, you can review the radar solution for vehicle counting or share your case so we can study its technical feasibility.